

Ch. 7 - Hypothesis Testing with One Sample
Larson - Elementary Statistics: Picturing the World 8th Edition
Larson8th EditionElementary Statistics: Picturing the WorldISBN: 9780137493470Non è quello che usi tu?Cambia libro di testo
Capitolo 7, Problema 7.5.13a

Graphical Analysis In Exercises 13 and 14, state whether each standardized test statistic X^2 allows you to reject the null hypothesis. Explain.


a. X^2=2.091
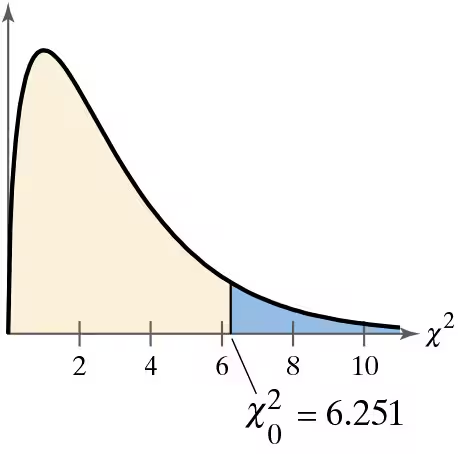
Graph showing a chi-squared distribution with shaded area indicating rejection region at X^2=6.251.

Guida verificata passo dopo passo
1
Step 1: Understand the problem. The question asks whether the standardized test statistic X^2 = 2.091 allows you to reject the null hypothesis. To answer this, compare the test statistic to the critical value (X^2_0 = 6.251) provided in the graph.
Step 2: Recall the decision rule for hypothesis testing using the chi-square test. If the test statistic X^2 is greater than the critical value X^2_0, you reject the null hypothesis. Otherwise, you fail to reject the null hypothesis.
Step 3: Analyze the graph. The critical value X^2_0 = 6.251 is marked on the chi-square distribution curve, dividing the rejection region (blue area) from the non-rejection region (yellow area). Values of X^2 less than 6.251 fall in the non-rejection region.
Step 4: Compare the test statistic X^2 = 2.091 to the critical value X^2_0 = 6.251. Since 2.091 is less than 6.251, it falls in the non-rejection region of the graph.
Step 5: Conclude based on the comparison. Since the test statistic does not exceed the critical value, you fail to reject the null hypothesis. This means there is insufficient evidence to support the alternative hypothesis.

Risposta video verificata per un problema simile:

Questa soluzione video è stata consigliata dai nostri tutor come utile per risolvere questo problema.
Durata del video:
2m

Concetti chiave

Ecco i concetti essenziali che devi comprendere per rispondere correttamente alla domanda.

Chi-Squared Distribution

The Chi-Squared distribution is a continuous probability distribution commonly used in hypothesis testing, particularly in tests of independence and goodness-of-fit. It is characterized by its right-skewed shape and is defined by degrees of freedom, which depend on the number of categories or variables involved. The distribution helps determine critical values for test statistics, which are used to assess the significance of observed data.
Video consigliato:
Percorso guidato
07:01
Intro to Least Squares Regression

Null Hypothesis

The null hypothesis is a statement that there is no effect or no difference, serving as a default position in statistical testing. It is typically denoted as H0 and is tested against an alternative hypothesis (H1) that suggests a significant effect or difference exists. In hypothesis testing, the goal is to determine whether the evidence from the data is strong enough to reject the null hypothesis in favor of the alternative.
Video consigliato:
Percorso guidato
06:21
Step 1: Write Hypotheses

Rejection Region

The rejection region is the area in the tail(s) of the distribution where, if the test statistic falls, the null hypothesis can be rejected. This region is determined by the significance level (alpha), which is the probability of making a Type I error. In the context of the Chi-Squared test, if the calculated Chi-Squared statistic exceeds the critical value (like 6.251 in the provided graph), it falls into the rejection region, indicating that the null hypothesis can be rejected.
Video consigliato:
Percorso guidato
09:56
Step 4: State Conclusion
Pratica correlata
Domanda del libro di testo

Writing Hypotheses: Backpack Manufacturer A backpack manufacturer claims that the mean life of its competitor’s backpacks is less than 5 years. You are asked to perform a hypothesis test to test this claim. How would you write the null and alternative hypotheses when


a. you represent the manufacturer and want to support the claim?

70
views
Domanda del libro di testo

Writing Hypotheses: Internet Provider An Internet provider is trying to gain advertising deals and claims that the mean time a customer spends online per day is greater than 28 minutes. You are asked to test this claim. How would you write the null and alternative hypotheses when


a. you represent the Internet provider and want to support the claim?

43
views
Domanda del libro di testo

Interpreting a Decision In Exercises 43–48, determine whether the claim represents the null hypothesis or the alternative hypothesis. If a hypothesis test is performed, how should you interpret a decision that


a. rejects the null hypothesis?


Gas Mileage An automotive manufacturer claims that the standard deviation for the gas mileage of one of the vehicles it manufactures is 3.9 miles per gallon.

54
views
Domanda del libro di testo

In Exercises 3–6, determine whether a normal sampling distribution can be used. If it can be used, test the claim.

Claim: p ≠0.15, α=0.05. Sample statistics: p_hat = 0.12, n=500

58
views
Domanda del libro di testo

Graphical Analysis In Exercises 9–12, state whether each standardized test statistic t allows you to reject the null hypothesis. Explain.


a. t = -1.755


32
views
Domanda del libro di testo

Interpreting a Decision In Exercises 43–48, determine whether the claim represents the null hypothesis or the alternative hypothesis. If a hypothesis test is performed, how should you interpret a decision that


a. rejects the null hypothesis?


Marketing A fitness equipment company claims that its competitor’s home gym does not have a customer satisfaction rate of 99%.

56
views