Ch. 7 - Hypothesis Testing with One Sample
Larson - Elementary Statistics: Picturing the World 8th Edition
Larson8th EditionElementary Statistics: Picturing the WorldISBN: 9780137493470Non è quello che usi tu?Cambia libro di testo
Capitolo 7, Problema 7.1.60

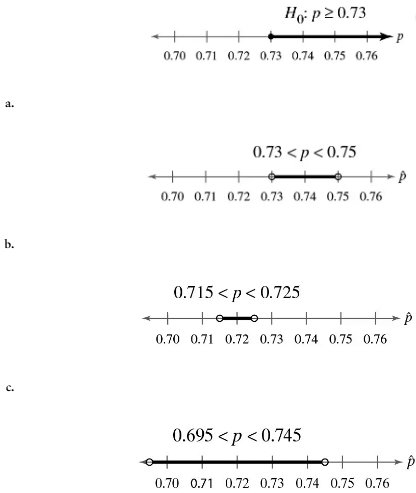
Graphical Analysis In Exercises 57–60, you are given a null hypothesis and three confidence intervals that represent three samplings. Determine whether each confidence interval indicates that you should reject H0. Explain your reasoning.
Graphical representation of null hypothesis and confidence intervals for statistical analysis.

Guida verificata passo dopo passo
1
Step 1: Understand the null hypothesis (H0). The null hypothesis states that p ≥ 0.73, where p represents the population proportion. To reject H0, the confidence interval must not include values greater than or equal to 0.73.
Step 2: Analyze confidence interval (a). The interval is 0.73 < p < 0.75. Since this interval starts at 0.73 and includes values greater than 0.73, it does not provide evidence to reject H0.
Step 3: Analyze confidence interval (b). The interval is 0.715 < p < 0.725. This interval does not include 0.73 or any values greater than 0.73, which suggests that H0 can be rejected based on this sampling.
Step 4: Analyze confidence interval (c). The interval is 0.695 < p < 0.745. This interval includes 0.73, so it does not provide evidence to reject H0.
Step 5: Summarize the findings. Confidence interval (b) indicates rejection of H0 because it excludes 0.73 and values greater than 0.73, while intervals (a) and (c) do not provide evidence to reject H0 as they include values greater than or equal to 0.73.

Risposta video verificata per un problema simile:

Questa soluzione video è stata consigliata dai nostri tutor come utile per risolvere questo problema.
Durata del video:
3m

Concetti chiave

Ecco i concetti essenziali che devi comprendere per rispondere correttamente alla domanda.

Null Hypothesis (H0)

The null hypothesis (H0) is a statement that there is no effect or no difference, and it serves as the default assumption in statistical testing. In this context, H0 states that the population proportion (p) is greater than or equal to 0.73. To determine whether to reject H0, we compare the confidence intervals from the samples to this hypothesis.
Video consigliato:
Percorso guidato
06:21
Step 1: Write Hypotheses

Confidence Interval

A confidence interval is a range of values derived from sample data that is likely to contain the true population parameter. Each confidence interval provides an estimate of where the true proportion (p) lies. If a confidence interval does not include the value specified in the null hypothesis, it suggests that we may reject H0.
Video consigliato:
Percorso guidato
06:33
Introduction to Confidence Intervals

Statistical Significance

Statistical significance refers to the likelihood that a result or relationship is caused by something other than mere random chance. In this scenario, if the confidence intervals for the sample proportions (p̂) do not overlap with the null hypothesis value (0.73), it indicates that the results are statistically significant, leading to a potential rejection of H0.
Video consigliato:
Percorso guidato
05:53
Parameters vs. Statistics