Ch. 7 - Hypothesis Testing with One Sample
Larson - Elementary Statistics: Picturing the World 8th Edition
Larson8th EditionElementary Statistics: Picturing the WorldISBN: 9780137493470Non è quello che usi tu?Cambia libro di testo
Capitolo 7, Problema 7.3.12c

Graphical Analysis In Exercises 9–12, state whether each standardized test statistic t allows you to reject the null hypothesis. Explain.


c. t = 1.7


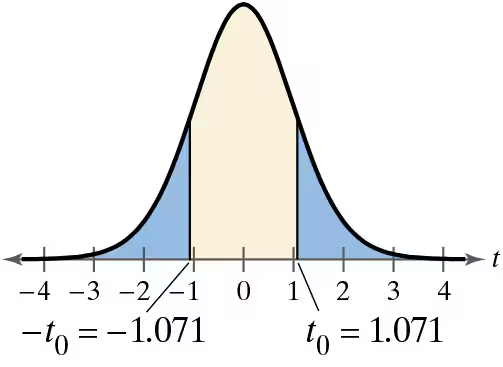
Graph of a t-distribution showing critical regions and standardized test statistic t = 1.7 for hypothesis testing.

Guida verificata passo dopo passo
1
Step 1: Understand the context of the problem. The standardized test statistic t is used in hypothesis testing to determine whether to reject the null hypothesis. The graph provided shows a t-distribution with critical values marked at t0 = ±1.071, which define the rejection regions for the null hypothesis.
Step 2: Identify the rejection regions. In the graph, the rejection regions are the areas outside the interval [-1.071, 1.071]. These regions are shaded in blue, indicating where the null hypothesis would be rejected.
Step 3: Compare the given test statistic t = 1.7 to the critical values. Since 1.7 is greater than the upper critical value of 1.071, it falls into the rejection region on the right side of the graph.
Step 4: Interpret the result. Because the test statistic t = 1.7 is in the rejection region, you can reject the null hypothesis based on the given significance level associated with the critical values.
Step 5: Explain the reasoning. The null hypothesis is rejected because the test statistic is sufficiently extreme (greater than 1.071), indicating that the observed data is unlikely under the null hypothesis.

Risposta video verificata per un problema simile:

Questa soluzione video è stata consigliata dai nostri tutor come utile per risolvere questo problema.
Durata del video:
2m

Concetti chiave

Ecco i concetti essenziali che devi comprendere per rispondere correttamente alla domanda.

Null Hypothesis

The null hypothesis is a statement that there is no effect or no difference, and it serves as the default assumption in hypothesis testing. Researchers aim to gather evidence against the null hypothesis to support an alternative hypothesis. In this context, rejecting the null hypothesis indicates that the test statistic provides sufficient evidence to suggest a significant effect or difference.
Video consigliato:
Percorso guidato
06:21
Step 1: Write Hypotheses

Standardized Test Statistic (t)

A standardized test statistic, such as t, measures how far a sample statistic is from the null hypothesis in terms of standard errors. The value of t helps determine whether to reject the null hypothesis based on its position relative to critical values in the t-distribution. In this case, a t value of 1.7 must be compared to critical values to assess its significance.
Video consigliato:
Percorso guidato
06:34
Step 2: Calculate Test Statistic

Critical Region

The critical region in hypothesis testing is the range of values for the test statistic that leads to the rejection of the null hypothesis. It is determined by the significance level (alpha) and is typically located in the tails of the distribution. In the provided graph, the critical regions are shaded, and if the test statistic falls within these regions, the null hypothesis can be rejected.
Video consigliato:
Percorso guidato
05:50
Critical Values: t-Distribution