Ch. 8 - Hypothesis Testing with Two Samples
Larson - Elementary Statistics: Picturing the World 8th Edition
Larson8th EditionElementary Statistics: Picturing the WorldISBN: 9780137493470Non è quello che usi tu?Cambia libro di testo
Capitolo 8, Problema 8.1.25

Getting at the Concept Explain why the null hypothesis Ho: μ1=μ2 is equivalent to the null hypothesis .Ho: μ1-μ2=0

Guida verificata passo dopo passo
1
Understand the null hypothesis Ho: μ1 = μ2. This hypothesis states that the population means of two groups (μ1 and μ2) are equal, implying no difference between the two groups.
Recognize that the null hypothesis Ho: μ1 - μ2 = 0 is another way of expressing the same idea. If the difference between the two population means (μ1 - μ2) is zero, it means the two means are equal.
Mathematically, the equivalence can be shown by rearranging the equation μ1 = μ2. Subtract μ2 from both sides to get μ1 - μ2 = 0. This demonstrates that the two forms of the null hypothesis are interchangeable.
Conceptually, both hypotheses test whether there is no difference between the two population means. The choice of expression depends on the context or the statistical test being used, but they represent the same null hypothesis.
In practice, statistical tests like the t-test often use the form Ho: μ1 - μ2 = 0 because it directly relates to the calculation of the test statistic, which is based on the difference between sample means.

Risposta video verificata per un problema simile:

Questa soluzione video è stata consigliata dai nostri tutor come utile per risolvere questo problema.
Durata del video:
1m

Concetti chiave

Ecco i concetti essenziali che devi comprendere per rispondere correttamente alla domanda.

Null Hypothesis

The null hypothesis is a fundamental concept in statistics that posits no effect or no difference between groups or conditions. It serves as a default position that indicates any observed effect in data is due to sampling variability. In hypothesis testing, the null hypothesis is typically denoted as H0 and is tested against an alternative hypothesis (H1) that suggests a significant effect or difference exists.
Video consigliato:
Percorso guidato
06:21
Step 1: Write Hypotheses

Population Means

Population means refer to the average values of a particular characteristic within a defined group. In the context of the null hypothesis H0: μ1=μ2, it asserts that the means of two populations (μ1 and μ2) are equal. This concept is crucial for comparing groups in statistical tests, as it helps determine whether any observed differences in sample means are statistically significant or not.
Video consigliato:
Percorso guidato
04:48
Population Standard Deviation Known

Difference of Means

The difference of means is a statistical measure that quantifies the disparity between the average values of two groups. The expression H0: μ1-μ2=0 is an alternative way to represent the null hypothesis, indicating that the difference between the two population means is zero. This formulation is often used in hypothesis testing to assess whether the observed difference in sample means is significant enough to reject the null hypothesis.
Video consigliato:
Percorso guidato
08:21
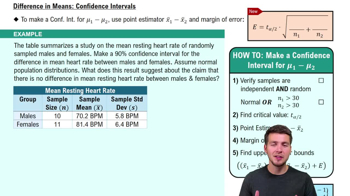
Difference in Means: Confidence Intervals
Pratica correlata
Domanda del libro di testo

In Exercises 7–10, the statement represents a claim. Write its complement and state which is Ho and which is Ha.


μ≠2.28

40
views

Domanda del libro di testo

Describe another way you can perform a hypothesis test for the difference between the means of two populations using independent samples with and known that does not use rejection regions.

76
views
Domanda del libro di testo

Independent and Dependent Samples In Exercises 5–8, classify the two samples as independent or dependent and justify your answer.

Sample 1: The commute times of 10 workers when they use their own vehicles

Sample 2: The commute times of the same 10 workers when they use public transportation

61
views
Domanda del libro di testo

Seat Belt Use In a survey of 1000 drivers from the West, 934 wear a seat belt. In a survey of 1000 drivers from the Northeast, 909 wear a seat belt. At α=0.05, can you support the claim that the proportion of drivers who wear seat belts is greater in the West than in the Northeast? (Adapted from National Highway Traffic Safety Administration)

46
views
Domanda del libro di testo

Constructing Confidence Intervals for μ1-μ2. When the sampling distribution for x̅1-x̅2 is approximated by a t-distribution and the populations have equal variances, you can construct a confidence interval for μ1-μ2, as shown below.

Construct the indicated confidence interval for μ1-μ2 . Assume the populations are approximately normal with equal variances.

10K Race 

To compare the mean ages of male and female participants in a 10K race, you randomly select several ages from both sexes. The results are shown below. Construct a 95% confidence interval for the difference in mean ages of male and female participants in the race. (Adapted from Great Race)

47
views
Domanda del libro di testo

In Exercises 11–14, test the claim about the difference between two population means and at the level of significance . Assume the samples are random and independent, and the populations are normally distributed.

Claim: μ1<μ2; α=0.05

Population statistics:σ1=75 and σ2=105

Sample Statistics: x̅1=2435, n1=35, x̅2=2432, n2=90

80
views