Ch. 8 - Hypothesis Testing with Two Samples
Larson - Elementary Statistics: Picturing the World 8th Edition
Larson8th EditionElementary Statistics: Picturing the WorldISBN: 9780137493470Non è quello che usi tu?Cambia libro di testo
Capitolo 8, Problema 8.RE.18c

In Exercises 17 and 18, (c) find the standardized test statistic t, Assume the samples are random and independent, and the populations are normally distributed.


A real estate agent claims that there is no difference between the mean household incomes of two neighborhoods. The mean income of 12 randomly selected households from the first neighborhood is \$52,750 with a standard deviation of \$2900. In the second neighborhood, 10 randomly selected households have a mean income of \$51,200 with a standard deviation of \$2225. At α=0.01, can you reject the real estate agent’s claim? Assume the population variances are equal.

Guida verificata passo dopo passo
1
Identify the hypotheses for the test: the null hypothesis \(H_0\) states that the mean incomes are equal, i.e., \(\mu_1 = \mu_2\), and the alternative hypothesis \(H_a\) states that the means are different, i.e., \(\mu_1 \neq \mu_2\).
Since the population variances are assumed equal, calculate the pooled standard deviation \(s_p\) using the formula: \[s_p = \sqrt{\frac{(n_1 - 1)s_1^2 + (n_2 - 1)s_2^2}{n_1 + n_2 - 2}}\] where \(n_1\) and \(n_2\) are the sample sizes, and \(s_1\) and \(s_2\) are the sample standard deviations.
Calculate the standard error of the difference between the two sample means using the pooled standard deviation: \[SE = s_p \times \sqrt{\frac{1}{n_1} + \frac{1}{n_2}}\]
Compute the test statistic \(t\) using the formula: \[t = \frac{\bar{x}_1 - \bar{x}_2}{SE}\] where \(\bar{x}_1\) and \(\bar{x}_2\) are the sample means.
Determine the degrees of freedom for the test as $df = n_1 + n_2 - 2$, then compare the calculated \(t\) value to the critical \(t\) value from the \(t\)-distribution table at \(\alpha = 0.01\) for a two-tailed test to decide whether to reject the null hypothesis.

Risposta video verificata per un problema simile:

Questa soluzione video è stata consigliata dai nostri tutor come utile per risolvere questo problema.
Durata del video:
5m

Concetti chiave

Ecco i concetti essenziali che devi comprendere per rispondere correttamente alla domanda.

Two-Sample t-Test for Means

This test compares the means of two independent samples to determine if there is a statistically significant difference between their population means. It is appropriate when samples are random, independent, and populations are normally distributed. The test statistic follows a t-distribution under the null hypothesis.
Video consigliato:
Percorso guidato
06:53
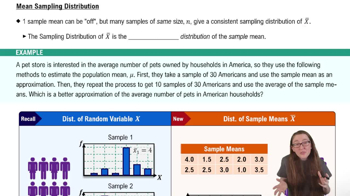
Sampling Distribution of Sample Mean

Pooled Variance and Equal Variance Assumption

When population variances are assumed equal, the sample variances are combined into a pooled variance estimate. This pooled variance provides a more accurate estimate of the common variance, which is used to calculate the standard error of the difference between means in the t-test.
Video consigliato:
Percorso guidato
04:48
Variance & Standard Deviation of Discrete Random Variables

Significance Level (α) and Hypothesis Testing

The significance level α (here 0.01) defines the threshold for rejecting the null hypothesis. If the calculated t-statistic falls in the critical region beyond the t-distribution cutoff, the null hypothesis (no difference in means) is rejected, indicating a statistically significant difference.
Video consigliato:
Percorso guidato
05:52
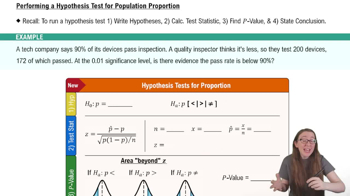
Performing Hypothesis Tests: Proportions
Pratica correlata
Domanda del libro di testo

In Exercises 1–4, classify the two samples as independent or dependent and justify your answer.


Sample 1: The fuel efficiencies of 12 cars

Sample 2: The fuel efficiencies of the same 12 cars using an alternative fuel


60
views
Domanda del libro di testo

"In Exercises 17 and 18, (b) find the critical value(s) and identify the rejection region(s), Assume the samples are random and independent, and the populations are normally distributed.


A real estate agent claims that there is no difference between the mean household incomes of two neighborhoods. The mean income of 12 randomly selected households from the first neighborhood is \$52,750 with a standard deviation of \$2900. In the second neighborhood, 10 randomly selected households have a mean income of \$51,200 with a standard deviation of \$2225. At α=0.01, can you reject the real estate agent’s claim? Assume the population variances are equal."

36
views
Domanda del libro di testo

In Exercises 11–16, test the claim about the difference between two population means μ1 and μ2 at the level of significance α. Assume the samples are random and independent, and the populations are normally distributed.


Claim: μ1= μ2; α=0.05. Assume (σ1)^2 = (σ2)^2


Sample statistics: x̅1=228, s1=27, n1= 20 and x̅2=207, s2=25, n2= 13

42
views
Domanda del libro di testo

In Exercises 5–8, test the claim about the difference between two population means μ1 and μ2 at the level of significance α. Assume the samples are random and independent, and the populations are normally distributed.


Claim: μ1≠μ2; α=0.05


Population statistics: σ1= 14 and σ2= 15


Sample statistics: x̅1 = 87, n1 = 410, and x̅2= 85, n2= 340

42
views
Domanda del libro di testo

In Exercises 1–4, classify the two samples as independent or dependent and justify your answer.


Sample 1: The weights of 45 oranges

Sample 2: The weights of 40 grapefruits


71
views
Domanda del libro di testo

Take this test as you would take a test in class.For each exercise, perform the steps below.

a. Identify the claim and state and


A real estate agency says that the mean home sales price in Olathe, Kansas, is greater than in Rolla, Missouri. The mean home sales price for 39 homes in Olathe is \$392,453. Assume the population standard deviation is \$224,902. The mean home sales price for 38 homes in Rolla is \$285,787. Assume the population standard deviation is \$330,578. At α=0.05, is there enough evidence to support the agency’s claim? (Adapted from Realtor.com)

28
views