


Ch. 8 - Hypothesis Testing with Two Samples
Larson - Elementary Statistics: Picturing the World 8th Edition
Larson8th EditionElementary Statistics: Picturing the WorldISBN: 9780137493470Non è quello che usi tu?Cambia libro di testo
Capitolo 8, Problema 8.1.6

Independent and Dependent Samples In Exercises 5–8, classify the two samples as independent or dependent and justify your answer.
Sample 1: The IQ scores of 60 females
Sample 2: The IQ scores of 60 males

Guida verificata passo dopo passo
1
Identify the two samples provided in the problem: Sample 1 consists of the IQ scores of 60 females, and Sample 2 consists of the IQ scores of 60 males.
Understand the concept of independent and dependent samples: Independent samples are those where the observations in one sample do not influence or are not paired with the observations in the other sample. Dependent samples, on the other hand, involve paired or related observations (e.g., before-and-after measurements on the same individuals).
Examine the relationship between the two samples: In this case, the IQ scores of females and males are measured separately, and there is no indication that the scores of one group are paired or related to the scores of the other group.
Conclude that the two samples are independent because the observations in one sample (females) do not influence or correspond to the observations in the other sample (males).
Justify the classification by noting that the problem does not mention any pairing or dependency between the two groups, such as matching individuals based on specific criteria or measuring the same individuals under different conditions.

Risposta video verificata per un problema simile:

Questa soluzione video è stata consigliata dai nostri tutor come utile per risolvere questo problema.
Durata del video:
2m

Concetti chiave

Ecco i concetti essenziali che devi comprendere per rispondere correttamente alla domanda.

Independent Samples

Independent samples refer to two or more groups that are not related or paired in any way. In statistical analysis, this means that the selection of individuals in one sample does not influence the selection in the other. For example, if we compare the IQ scores of females and males, these groups are independent because the scores of one group do not affect the scores of the other.
Video consigliato:
Percorso guidato
06:28
Independence Test

Dependent Samples

Dependent samples, also known as paired samples, involve groups that are related or matched in some way. This could occur in scenarios where the same subjects are measured under different conditions or at different times. For instance, if we measured the IQ scores of the same individuals before and after a specific intervention, those scores would be considered dependent.
Video consigliato:
Percorso guidato
05:17
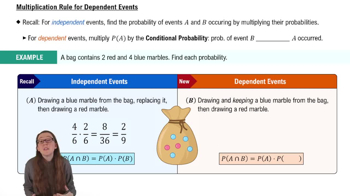
Multiplication Rule: Dependent Events

Statistical Justification

Statistical justification involves providing reasoning based on statistical principles to classify samples as independent or dependent. This includes analyzing the relationship between the samples and understanding how the data was collected. In the given question, the justification for classifying the IQ scores of females and males as independent samples is based on the fact that the two groups are distinct and do not influence each other.
Video consigliato:
Percorso guidato
05:53
Parameters vs. Statistics
Pratica correlata
Domanda del libro di testo

Constructing Confidence Intervals for p1-p2 You can construct a confidence interval for the difference between two population proportions p1-p2 by using the inequality below.


[Image] Complicated mathematical formula.


In Exercises 23–26, construct the indicated confidence interval for p1-p2. Assume the samples are random and independent.


Critical Threats Repeat Exercise 25 but with a 99% confidence interval. Describe the likelihood that equal proportions of the population see cyberterrorism and the spread of infectious diseases as critical threats in the next 10 years.

150
views
Domanda del libro di testo

Test the claim about the difference between two population means and at the level of significance α. Assume the samples are random and independent, and the populations are normally distributed.

Claim: μ1<μ2, α=0.10, Assume (σ1)^2=(σ2)^2

Sample statistics:

x̅1=0.345, s1=0.305 , n1=11 and x̅2=0.515, s2=0.215, n2=9

52
views
Domanda del libro di testo

Testing the Difference Between Two Proportions In Exercises 7–12, (a) identify the claim and state Ho and Ha, (b) find the critical value(s) and identify the rejection region(s), (c) find the standardized test statistic z, (d) decide whether to reject or fail to reject the null hypothesis, and (e) interpret the decision in the context of the original claim. Assume the samples are random and independent.


Multiple Sclerosis Drug In a study to determine the effectiveness of using a drug to treat multiple sclerosis, 488 subjects were given the drug and 244 subjects were given a placebo. The numbers of subjects who had 12-week confirmed disability progression were tracked. The results are shown at the left. At α=0.01, can you support the claim that there is a difference in the proportion of subjects who had no 12-week confirmed disability progression? (Adapted from The New England Journal of Medicine)


70
views
Domanda del libro di testo

[APPLET] Teaching Methods

Two teaching methods and their effects on science test scores are being reviewed. A group of students is taught in traditional lab sessions. A second group of students is taught using interactive simulation software. The science test scores for the two groups are shown in the back-to-back stem-and-leaf plot.

At , α=0.01 can you support the claim that the mean science test score is lower for students taught using the traditional lab method than it is for students taught using the interactive simulation software? Assume the population variances are equal.

61
views
Domanda del libro di testo

Testing the Difference Between Two Means In Exercises 15–24, (a) identify the claim and state Ho and Ha, (b) find the critical value(s) and identify the rejection region(s), (c) find the standardized test statistic z, (d) decide whether to reject or fail to reject the null hypothesis, and (e) interpret the decision in the context of the original claim. Assume the samples are random and independent, and the populations are normally distributed.

ACT English and Reading Scores The mean ACT English score for 120 high school students is 19.9. Assume the population standard deviation is 7.2. The mean ACT reading score for 150 high school students is 21.2. Assume the population standard deviation is 7.1. At α=0.10, can you support the claim that ACT reading scores are higher than ACT English scores? (Source: ACT, Inc.)

52
views
Domanda del libro di testo

Find the critical value(s) for the alternative hypothesis, level of significance , and sample sizes and . Assume that the samples are random and independent, the populations are normally distributed, and the population variances are (a) equal and (b) not equal.

Ha:μ1>μ2 , α=0.01 , n1=12 , n2=15

128
views