


Ch. 8 - Hypothesis Testing with Two Samples
Larson - Elementary Statistics: Picturing the World 8th Edition
Larson8th EditionElementary Statistics: Picturing the WorldISBN: 9780137493470Non è quello che usi tu?Cambia libro di testo
Capitolo 8, Problema 8.Q.3

Take this quiz as you would take a quiz in class. After you are done, check your work against the answers given in the back of the book.For each exercise, perform the steps below.


a. Identify the claim and state Ho and Ha


b. Determine whether the hypothesis test is left-tailed, right-tailed, or two-tailed, and whether to use a z-test or a t-test. Explain your reasoning.


c. Find the critical value(s) and identify the rejection region(s).


d. Find the appropriate standardized test statistic.


e. Decide whether to reject or fail to reject the null hypothesis.


f. Interpret the decision in the context of the original claim.


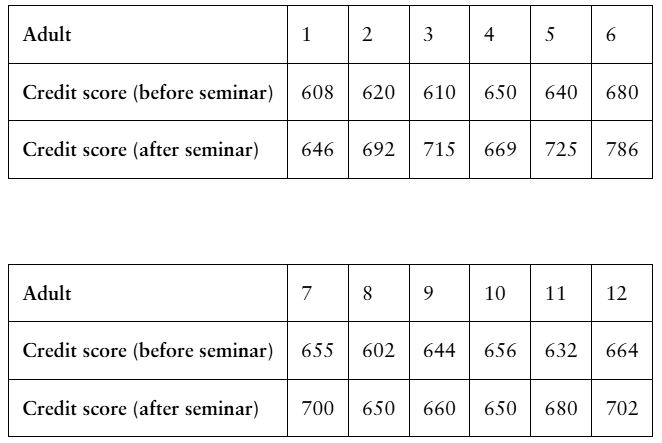
[APPLET] The table shows the credit scores for 12 randomly selected adults who are considered high-risk borrowers before and two years after they attend a personal finance seminar. At α=0.01, is there enough evidence to support the claim that the personal finance seminar helps adults increase their credit scores? Assume the populations are normally distributed.

Guida verificata passo dopo passo
1
Step 1: Identify the claim and state the null hypothesis (Ho) and alternative hypothesis (Ha). The claim is that the personal finance seminar helps adults increase their credit scores. This implies that the mean difference in credit scores (after - before) is greater than 0. Thus, Ho: μd = 0 (no increase in credit scores) and Ha: μd > 0 (credit scores increase).
Step 2: Determine the type of test and whether it is left-tailed, right-tailed, or two-tailed. Since the alternative hypothesis (Ha) is μd > 0, this is a right-tailed test. Additionally, because the sample size is small (n = 12) and the population standard deviation is unknown, a t-test for paired samples is appropriate.
Step 3: Find the critical value(s) and identify the rejection region(s). Using a t-distribution table and α = 0.01 with degrees of freedom (df = n - 1 = 11), find the critical t-value for a right-tailed test. The rejection region is t > critical value.
Step 4: Calculate the standardized test statistic. First, compute the differences (d = after - before) for each individual, then calculate the mean difference (d̄) and the standard deviation of the differences (Sd). Use the formula for the t-statistic: t = (d̄ - 0) / (Sd / √n), where n is the sample size.
Step 5: Compare the calculated t-statistic to the critical value. If the t-statistic falls in the rejection region (t > critical value), reject the null hypothesis. Otherwise, fail to reject the null hypothesis. Finally, interpret the decision in the context of the original claim: if Ho is rejected, conclude that there is enough evidence to support the claim that the seminar helps increase credit scores; otherwise, conclude that there is not enough evidence.

Risposta video verificata per un problema simile:

Questa soluzione video è stata consigliata dai nostri tutor come utile per risolvere questo problema.
Durata del video:
11m

Concetti chiave

Ecco i concetti essenziali che devi comprendere per rispondere correttamente alla domanda.

Hypothesis Testing

Hypothesis testing is a statistical method used to make decisions about a population based on sample data. It involves formulating two competing hypotheses: the null hypothesis (H0), which represents no effect or no difference, and the alternative hypothesis (Ha), which indicates the presence of an effect or difference. The goal is to determine whether there is enough evidence to reject H0 in favor of Ha.
Video consigliato:
Percorso guidato
05:52
Performing Hypothesis Tests: Proportions

Types of Tests (Z-test vs. T-test)

The choice between a z-test and a t-test depends on the sample size and whether the population standard deviation is known. A z-test is used when the sample size is large (typically n > 30) or when the population standard deviation is known. A t-test is appropriate for smaller samples (n ≤ 30) or when the population standard deviation is unknown, as it accounts for additional uncertainty in estimating the population parameters.
Video consigliato:
Percorso guidato
06:28
Independence Test

Critical Values and Rejection Regions

Critical values are the threshold points that define the boundaries of the rejection region in hypothesis testing. The rejection region is the set of values for the test statistic that leads to the rejection of the null hypothesis. Depending on whether the test is one-tailed or two-tailed, critical values are determined based on the significance level (α), which indicates the probability of making a Type I error.
Video consigliato:
Percorso guidato
05:50
Critical Values: t-Distribution
Pratica correlata
Domanda del libro di testo

Take this quiz as you would take a quiz in class. After you are done, check your work against the answers given in the back of the book.For each exercise, perform the steps below.

b. Determine whether the hypothesis test is left-tailed, right-tailed, or two-tailed, and whether to use a z-test or a t-test. Explain your reasoning.

The mean score on a reading assessment test for 49 randomly selected male high school students was 279. Assume the population standard deviation is 41. The mean score on the same test for 50 randomly selected female high school students was 292. Assume the population standard deviation is 39. At α=0.05, can you support the claim that the mean score on the reading assessment test for male high school students is less than the mean score for female high school students? (Adapted from National Center for Education Statistics)

55
views
Domanda del libro di testo

Take this quiz as you would take a quiz in class. After you are done, check your work against the answers given in the back of the book.For each exercise, perform the steps below.

f. Interpret the decision in the context of the original claim.

The mean score on a reading assessment test for 49 randomly selected male high school students was 279. Assume the population standard deviation is 41. The mean score on the same test for 50 randomly selected female high school students was 292. Assume the population standard deviation is 39. At α=0.05, can you support the claim that the mean score on the reading assessment test for male high school students is less than the mean score for female high school students? (Adapted from National Center for Education Statistics)

35
views
Domanda del libro di testo

Take this quiz as you would take a quiz in class. After you are done, check your work against the answers given in the back of the book.For each exercise, perform the steps below.


c. Find the critical value(s) and identify the rejection region(s).

The mean score on a reading assessment test for 49 randomly selected male high school students was 279. Assume the population standard deviation is 41. The mean score on the same test for 50 randomly selected female high school students was 292. Assume the population standard deviation is 39. At α=0.05, can you support the claim that the mean score on the reading assessment test for male high school students is less than the mean score for female high school students? (Adapted from National Center for Education Statistics)

62
views
Domanda del libro di testo

In Exercises 7–10, the statement represents a claim. Write its complement and state which is Ho and which is Ha.


σ=0.63

42
views
Domanda del libro di testo

The mean room rate for two adults for a random sample of 26 three-star hotels in Cincinnati has a sample standard deviation of \$31. Assume the population is normally distributed. (Adapted from Expedia)


Construct a 99% confidence interval for the population variance.

44
views
Domanda del libro di testo

Take this quiz as you would take a quiz in class. After you are done, check your work against the answers given in the back of the book.For each exercise, perform the steps below.


a. Identify the claim and state Ho and Ha


b. Determine whether the hypothesis test is left-tailed, right-tailed, or two-tailed, and whether to use a z-test or a t-test. Explain your reasoning.


c. Find the critical value(s) and identify the rejection region(s).


d. Find the appropriate standardized test statistic.


e. Decide whether to reject or fail to reject the null hypothesis.


f. Interpret the decision in the context of the original claim.


A music teacher claims that the mean scores on a music assessment test for eighth grade students in public and private schools are equal. The mean score for 13 randomly selected public school students is 146 with a standard deviation of 49, and the mean score for 15 randomly selected private school students is 160 with a standard deviation of 42. At α=0.1, can you reject the teacher’s claim? Assume the populations are normally distributed and the population variances are equal. (Adapted from National Center for Education Statistics)

61
views