

Ch. 8 - Hypothesis Testing with Two Samples
Larson - Elementary Statistics: Picturing the World 8th Edition
Larson8th EditionElementary Statistics: Picturing the WorldISBN: 9780137493470Non è quello che usi tu?Cambia libro di testo
Capitolo 8, Problema 8.2.14c

Testing the Difference Between Two Means, (c) find the standardized test statistic t, 
Assume the samples are random and independent, and the populations are normally distributed.
Transactions
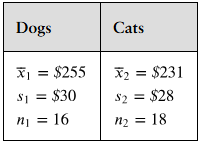
 A magazine claims that the mean amount spent by a customer at Burger Stop is greater than the mean amount spent by a customer at Fry World. The results for samples of customer transactions for the two fast food restaurants are shown at the left. At , α=0.05 can you support the magazine’s claim? Assume the population variances are equal.
Table comparing sample means, standard deviations, and sizes for two groups: Dogs and Cats.

Guida verificata passo dopo passo
1
Identify the sample statistics given: For Dogs (group 1), the sample mean \( \bar{x}_1 = 255 \), sample standard deviation \( s_1 = 30 \), and sample size \( n_1 = 16 \). For Cats (group 2), the sample mean \( \bar{x}_2 = 231 \), sample standard deviation \( s_2 = 28 \), and sample size \( n_2 = 18 \).
Since the population variances are assumed equal, calculate the pooled standard deviation \( s_p \) using the formula: \[ s_p = \sqrt{ \frac{(n_1 - 1)s_1^2 + (n_2 - 1)s_2^2}{n_1 + n_2 - 2} } \]
Calculate the standard error (SE) of the difference between the two means using the pooled standard deviation: \[ SE = s_p \times \sqrt{ \frac{1}{n_1} + \frac{1}{n_2} } \]
Compute the test statistic \( t \) for the difference between two means with equal variances: \[ t = \frac{\bar{x}_1 - \bar{x}_2}{SE} \]
Determine the degrees of freedom (df) for the test: \[ df = n_1 + n_2 - 2 \] Use this \( t \)-value and \( df \) to compare against the critical value from the \( t \)-distribution at \( \alpha = 0.05 \) for a one-tailed test to decide whether to support the magazine's claim.

Risposta video verificata per un problema simile:

Questa soluzione video è stata consigliata dai nostri tutor come utile per risolvere questo problema.
Durata del video:
4m

Concetti chiave

Ecco i concetti essenziali che devi comprendere per rispondere correttamente alla domanda.

Two-Sample t-Test for Means

This test compares the means of two independent groups to determine if there is a statistically significant difference between them. It assumes the samples are random, independent, and populations are normally distributed. The test statistic follows a t-distribution when population variances are unknown but assumed equal.
Video consigliato:
Percorso guidato
06:53
Sampling Distribution of Sample Mean

Pooled Variance and Equal Variance Assumption

When population variances are assumed equal, the sample variances are combined to calculate a pooled variance. This pooled variance provides a more accurate estimate of the common variance, which is used in the denominator of the t-test formula to standardize the difference between sample means.
Video consigliato:
Percorso guidato
04:48
Variance & Standard Deviation of Discrete Random Variables

Significance Level (α) and Hypothesis Testing

The significance level α (here 0.05) defines the threshold for rejecting the null hypothesis. If the calculated t-statistic falls in the critical region beyond this threshold, the null hypothesis is rejected, supporting the claim that one mean is greater than the other with a specified confidence level.
Video consigliato:
Percorso guidato
05:52
Performing Hypothesis Tests: Proportions
Pratica correlata
Domanda del libro di testo

Testing the Difference Between Two Means (c) calculate d̄ and Sd, Assume the samples are random and dependent, and the populations are normally distributed.

Interval Training

A researcher claims that sprint interval training improves running performance in trained athletes. The table shows the maximum aerobic speed (MAS), in kilometers per hour, of trained athletes before and after six sessions of sprint interval training. At , α=0.10 is there enough evidence to support the researcher’s claim? (Adapted from National Strength and Conditioning Association)

69
views
Domanda del libro di testo

Testing the Difference Between Two Means (b) find the critical value(s) and identify the rejection region(s), Assume the samples are random and dependent, and the populations are normally distributed.

Interval Training

A researcher claims that sprint interval training improves running performance in trained athletes. The table shows the maximum aerobic speed (MAS), in kilometers per hour, of trained athletes before and after six sessions of sprint interval training. At , α=0.10 is there enough evidence to support the researcher’s claim? (Adapted from National Strength and Conditioning Association)

52
views
Domanda del libro di testo

Testing the Difference Between Two Means (c) calculate d̄ and Sd, Assume the samples are random and dependent, and the populations are normally distributed.

[APPLET] Passing Play Percentages The passing play percentages of 10 randomly selected NCAA Division 1A college football teams for home and away games in the 2020–2021 season are shown in the table. At , α=0.20 is there enough evidence to support the claim that passing play percentage is different for home and away games? (Source: TeamRankings)

69
views
Domanda del libro di testo

Testing the Difference Between Two Means (d) find the standardized test statistic t, Assume the samples are random and dependent, and the populations are normally distributed.

Interval Training

A researcher claims that sprint interval training improves running performance in trained athletes. The table shows the maximum aerobic speed (MAS), in kilometers per hour, of trained athletes before and after six sessions of sprint interval training. At , α=0.10 is there enough evidence to support the researcher’s claim? (Adapted from National Strength and Conditioning Association)

43
views
Domanda del libro di testo

Testing the Difference Between Two Means (c) calculate d̄ and Sd, Assume the samples are random and dependent, and the populations are normally distributed.

[APPLET] Migraines

A researcher claims that injections of onabotulinumtoxinA reduce the number of days per month that chronic migraine sufferers have headaches. The table shows the number of days chronic migraine sufferers suffered migraines before and after using the treatment. At , α= 0.01 is there enough evidence to support the researcher’s claim? (Adapted from Journal of Headache and Pain)

80
views
Domanda del libro di testo

Testing the Difference Between Two Means, 

(d) decide whether to reject or fail to reject the null hypothesis. Assume the samples are random and independent, and the populations are normally distributed.

Transactions

 A magazine claims that the mean amount spent by a customer at Burger Stop is greater than the mean amount spent by a customer at Fry World. The results for samples of customer transactions for the two fast food restaurants are shown at the left. At , α=0.05 can you support the magazine’s claim? Assume the population variances are equal.

42
views