Ch. 8 - Hypothesis Testing with Two Samples
Larson - Elementary Statistics: Picturing the World 8th Edition
Larson8th EditionElementary Statistics: Picturing the WorldISBN: 9780137493470Non è quello che usi tu?Cambia libro di testo
Capitolo 8, Problema 8.4.9

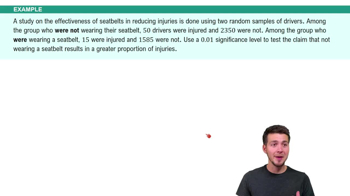
Young Adults In a survey of 3500 males ages 20 to 24 whose highest level of education is some college, but no bachelor’s degree, 80.2% were employed. In a survey of 2000 males ages 20 to 24 whose highest level of education is a bachelor’s degree or higher, 86.4% were employed. At α=0.01, can you support the claim that there is a difference in the proportion of those employed between the two groups? (Adapted from National Center for Education Statistics)

Guida verificata passo dopo passo
1
Step 1: Define the null and alternative hypotheses. The null hypothesis (H₀) states that there is no difference in the proportion of employed individuals between the two groups: p₁ = p₂. The alternative hypothesis (Hₐ) states that there is a difference in the proportions: p₁ ≠ p₂.
Step 2: Identify the sample proportions and sample sizes. For the first group (some college, no bachelor’s degree), the sample size is n₁ = 3500 and the sample proportion is p̂₁ = 0.802. For the second group (bachelor’s degree or higher), the sample size is n₂ = 2000 and the sample proportion is p̂₂ = 0.864.
Step 3: Calculate the pooled proportion (p̂) under the null hypothesis. Use the formula: p̂ = (x₁ + x₂) / (n₁ + n₂), where x₁ = n₁ * p̂₁ and x₂ = n₂ * p̂₂. This pooled proportion represents the overall proportion of employed individuals across both groups.
Step 4: Compute the test statistic (z). Use the formula: z = (p̂₁ - p̂₂) / √[p̂(1 - p̂)(1/n₁ + 1/n₂)]. This formula accounts for the difference in sample proportions and the variability due to sampling.
Step 5: Compare the test statistic to the critical value or p-value at α = 0.01. For a two-tailed test, find the critical z-values corresponding to α/2 = 0.005. If the absolute value of the test statistic exceeds the critical value, or if the p-value is less than 0.01, reject the null hypothesis. Otherwise, fail to reject the null hypothesis.

Risposta video verificata per un problema simile:

Questa soluzione video è stata consigliata dai nostri tutor come utile per risolvere questo problema.
Durata del video:
6m

Concetti chiave

Ecco i concetti essenziali che devi comprendere per rispondere correttamente alla domanda.

Hypothesis Testing

Hypothesis testing is a statistical method used to make decisions about population parameters based on sample data. It involves formulating a null hypothesis (H0) that represents no effect or difference, and an alternative hypothesis (H1) that indicates the presence of an effect or difference. In this context, the null hypothesis would state that there is no difference in employment proportions between the two educational groups.
Video consigliato:
Percorso guidato
06:21
Step 1: Write Hypotheses

Proportion Comparison

Comparing proportions involves analyzing the differences between two or more groups regarding a categorical outcome. In this case, we are comparing the employment rates of two groups of young males based on their education levels. This comparison can be conducted using statistical tests such as the z-test for proportions, which assesses whether the observed difference is statistically significant.
Video consigliato:
Percorso guidato
10:28
Difference in Proportions: Hypothesis Tests Example 1

Significance Level (α)

The significance level, denoted as α, is the threshold for determining whether to reject the null hypothesis. It represents the probability of making a Type I error, which occurs when the null hypothesis is incorrectly rejected. In this scenario, α is set at 0.01, indicating a 1% risk of concluding that there is a difference in employment proportions when there is none, thus requiring strong evidence to support the claim.
Video consigliato:
Percorso guidato
03:33
Finding Binomial Probabilities Using TI-84 Example 1
Pratica correlata
Domanda del libro di testo

Test the claim about the difference between two population means and at the level of significance α. Assume the samples are random and independent, and the populations are normally distributed.

Claim: μ1=μ2, α=0.01, Assume (σ1)^2=(σ2)^2

93
views
Domanda del libro di testo

Testing the Difference Between Two Proportions In Exercises 7–12, (a) identify the claim and state Ho and Ha, (b) find the critical value(s) and identify the rejection region(s), (c) find the standardized test statistic z, (d) decide whether to reject or fail to reject the null hypothesis, and (e) interpret the decision in the context of the original claim. Assume the samples are random and independent.


Multiple Sclerosis Drug In a study to determine the effectiveness of using a drug to treat multiple sclerosis, 488 subjects were given the drug and 244 subjects were given a placebo. The numbers of subjects who had 12-week confirmed disability progression were tracked. The results are shown at the left. At α=0.01, can you support the claim that there is a difference in the proportion of subjects who had no 12-week confirmed disability progression? (Adapted from The New England Journal of Medicine)


70
views
Domanda del libro di testo

Constructing Confidence Intervals for μ1-μ2. You can construct a confidence interval for the difference between two population means μ1-μ2 , as shown below, when both population standard deviations are known, and either both populations are normally distributed or both n1>= 30 and n2>=30 . Also, the samples must be randomly selected and independent.

[Image]

In Exercises 29 and 30, construct the indicated confidence interval for μ1-μ2 .


Software Engineer Salaries Construct a 95% confidence interval for the difference between the mean annual salaries of entry level software engineers in Santa Clara, California, and Greenwich, CT, using the data from Exercise 27.

113
views
Domanda del libro di testo

What conditions are necessary to use the dependent samples t-test for the mean of the differences for a population of paired data?

140
views
Domanda del libro di testo

[APPLET] Teaching Methods

Two teaching methods and their effects on science test scores are being reviewed. A group of students is taught in traditional lab sessions. A second group of students is taught using interactive simulation software. The science test scores for the two groups are shown in the back-to-back stem-and-leaf plot.

At , α=0.01 can you support the claim that the mean science test score is lower for students taught using the traditional lab method than it is for students taught using the interactive simulation software? Assume the population variances are equal.

61
views
Domanda del libro di testo

What conditions are necessary to use the t-test for testing the difference between two population means?

195
views