



Ch. 9 - Correlation and Regression
Larson - Elementary Statistics: Picturing the World 8th Edition
Larson8th EditionElementary Statistics: Picturing the WorldISBN: 9780137493470Non è quello che usi tu?Cambia libro di testo
Capitolo 9, Problema 9.3.3

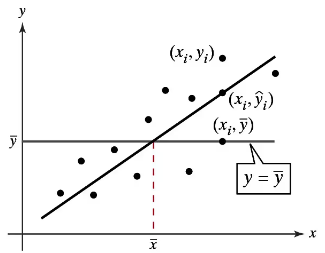
"Graphical Analysis In Exercises 1–3, use the figure.
Scatter plot showing data points, a regression line, and annotations for residuals and average values.
Describe the unexplained variation about a regression line in words and in symbols."

Guida verificata passo dopo passo
1
The unexplained variation about a regression line refers to the differences between the observed values (yᵢ) and the predicted values (ŷᵢ) for each data point. This difference is also known as the residual.
In the scatter plot, the residual for a data point is represented by the vertical distance between the observed value (yᵢ) and the predicted value (ŷᵢ) on the regression line.
Mathematically, the residual for the i-th data point is expressed as: rᵢ = yᵢ - ŷᵢ, where yᵢ is the observed value and ŷᵢ is the predicted value from the regression line.
The unexplained variation is the sum of the squared residuals across all data points, which is used to measure how well the regression line fits the data. This is expressed as: Σ(yᵢ - ŷᵢ)².
In words, the unexplained variation quantifies the portion of the total variation in the dependent variable (y) that is not accounted for by the regression model.

Risposta video verificata per un problema simile:

Questa soluzione video è stata consigliata dai nostri tutor come utile per risolvere questo problema.
Durata del video:
3m

Concetti chiave

Ecco i concetti essenziali che devi comprendere per rispondere correttamente alla domanda.

Regression Line

A regression line is a statistical tool used to model the relationship between a dependent variable and one or more independent variables. It represents the best fit line through a scatter plot of data points, minimizing the distance between the points and the line. The equation of the regression line can be expressed as y = mx + b, where m is the slope and b is the y-intercept.
Video consigliato:
Percorso guidato
04:57
Using Regression Lines to Predict Values

Residuals

Residuals are the differences between the observed values and the values predicted by the regression line. They are calculated as e_i = y_i - ŷ_i, where y_i is the actual value and ŷ_i is the predicted value. Analyzing residuals helps assess the accuracy of the regression model and identify any patterns that may indicate a poor fit.
Video consigliato:
Percorso guidato
07:38
Residuals and Residual Plots

Unexplained Variation

Unexplained variation refers to the portion of the total variation in the dependent variable that cannot be accounted for by the regression model. It is represented by the sum of the squared residuals and indicates how much of the variability in the data remains after fitting the model. Understanding unexplained variation is crucial for evaluating the effectiveness of the regression analysis.
Video consigliato:
Percorso guidato
06:14
Coefficient of Determination
Pratica correlata
Domanda del libro di testo

"Constructing and Interpreting a Prediction Interval In Exercises 21-30, construct the indicated prediction interval and interpret the results.

29. New Vehicle Sales Construct a 95% prediction interval for new vehicle sales for General Motors in Exercise 19 when the number of new vehicles sold by Ford is 2028 thousand."

66
views
Domanda del libro di testo

The coefficient of determination r^2 is the ratio of which two types of variations? What does r^2 measure? What does 1 - r^2 measure?

147
views
Domanda del libro di testo

6. Why is it not appropriate to use a regression line to predict y-values for x-values that are not in (or close to) the range of x-values found in the data?

299
views
Domanda del libro di testo

"Old Vehicles In Exercises 31–34, use the figure shown at the left.

Error of Estimate Find the standard error of estimate Se and interpret the results."

57
views
Domanda del libro di testo

Graphical Analysis In Exercises 11–14, determine whether there is a perfect positive linear correlation, a strong positive linear correlation, a perfect negative linear correlation, a strong negative linear correlation, or no linear correlation between the variables.

54
views
Domanda del libro di testo

"Constructing and Interpreting a Prediction Interval In Exercises 21-30, construct the indicated prediction interval and interpret the results.

28. Total Assets Construct a 90% prediction interval for the total assets in federal defined benefit plans in Exercise 18 when the total assets in IRAs are \$6400 billion."

60
views