


Ch. 9 - Correlation and Regression
Larson - Elementary Statistics: Picturing the World 8th Edition
Larson8th EditionElementary Statistics: Picturing the WorldISBN: 9780137493470Non è quello che usi tu?Cambia libro di testo
Capitolo 9, Problema 9.R.19

"In Exercises 19-24, construct the indicated prediction interval and interpret the results.
19. Construct a 90% prediction interval for the amount of milk produced in Exercise 9 when there are an average of 9275 thousand milk cows."

Guida verificata passo dopo passo
1
Identify the regression model from Exercise 9, which relates the number of milk cows to the amount of milk produced. This model typically has the form: \(\hat{y}\) = b+mx, where \(\hat{y}\) is the predicted milk production and x is the number of milk cows (in thousands).
Calculate the predicted value of milk production, \(\hat{y}\), by substituting x = 9275 into the regression equation.
Determine the standard error of the prediction, which accounts for both the variability of the estimate of the mean response and the variability of individual observations. The formula for the standard error of prediction is: SE_{pred} = s \(\sqrt{1 + \frac{1}{n}\) + \(\frac{(x_0 - \bar{x}\))^2}{\(\sum\) (x_i - \(\bar{x}\))^2}}, where s is the standard error of the estimate, n is the sample size, x_0 is 9275, and \(\bar{x}\) is the mean of the x values.
Find the critical t-value for a 90% prediction interval with degrees of freedom equal to n - 2. This value comes from the t-distribution table and corresponds to the desired confidence level.
Construct the 90% prediction interval using the formula: \(\hat{y}\) \(\pm\) t_{\(\alpha\)/2, n-2} \(\times\) SE_{pred}. This interval estimates the range in which a single new observation of milk production is expected to fall when there are 9275 thousand milk cows.

Risposta video verificata per un problema simile:

Questa soluzione video è stata consigliata dai nostri tutor come utile per risolvere questo problema.
Durata del video:
8m

Concetti chiave

Ecco i concetti essenziali che devi comprendere per rispondere correttamente alla domanda.

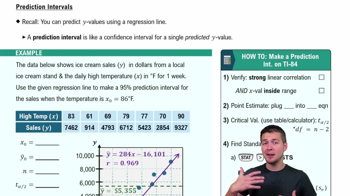
Prediction Interval

A prediction interval estimates the range within which a single future observation is expected to fall, with a specified level of confidence. Unlike confidence intervals for the mean, prediction intervals account for both the uncertainty in estimating the mean and the variability of individual observations.
Video consigliato:
Percorso guidato
09:00
Prediction Intervals

Confidence Level

The confidence level, such as 90%, represents the probability that the prediction interval contains the true future value. It reflects the degree of certainty we have in the interval estimate, with higher levels indicating wider intervals to capture more uncertainty.
Video consigliato:
Percorso guidato
06:33
Introduction to Confidence Intervals

Regression and Use of Predictor Variables

Prediction intervals often rely on regression models that relate a predictor variable (e.g., number of milk cows) to a response variable (e.g., milk production). Understanding how to use the regression equation and the variability around the predicted value is essential to construct accurate prediction intervals.
Video consigliato:
Percorso guidato
04:57
Using Regression Lines to Predict Values
Pratica correlata
Domanda del libro di testo

"In Exercises 17 and 18, use the data to (a) find the coefficient of determination r^2 and interpret

the result, and (b) find the standard error of estimate s_e and interpret the result.

17. The table shows the times (in seconds) to accelerate from 0 to 60 miles per hour and the top speeds (in miles per hour) for eight electric cars. The regression equation is y =- 14.399x + 196.996. (Source: Car and Driver)

56
views
Domanda del libro di testo

"In Exercises 19-24, construct the indicated prediction interval and interpret the results.

22. Construct a 95% prediction interval for the fuel efficiency of an automobile in Exercise 12 that has an engine displacement of 265 cubic inches."

58
views
Domanda del libro di testo

"In Exercises 19-24, construct the indicated prediction interval and interpret the results.

20. Construct a 90% prediction interval for the average time adults ages 35 to 44 spend per day watching television in Exercise 10 when the average time adults ages 25 to 34 spend per day watching television is 2.25 hours."

65
views
Domanda del libro di testo

"In Exercises 27 and 28, use the multiple regression equation to predict the y-values for the values of the independent variables.

27. An equation that can be used to predict fuel economy (in miles per gallon) for automobiles is

y=41.3- 0.004x_1 - 0.0049x_2

where x_1 is the engine displacement (in cubic inches) and x_2 is the vehicle weight (in

pounds).

a. x_1 = 305, x_2 = 3750

b. x_1 = 225, x_2 = 3100

c. x_1 = 105, x_2 = 2200

d. x_1 = 185, x_2 = 3000"

32
views
Domanda del libro di testo

"In Exercises 19-24, construct the indicated prediction interval and interpret the results.

24. Construct a 99% prediction interval for the price of a gas grill in Exercise 18 with a usable cooking area of 900 square inches."

36
views
Domanda del libro di testo

"In Exercises 19-24, construct the indicated prediction interval and interpret the results.

23. Construct a 99% prediction interval for the top speed of an electric car in Exercise 17 that takes 5.9 seconds to accelerate from 0 to 60 miles per hour."

61
views