

Ch. 9 - Correlation and Regression
Larson - Elementary Statistics: Picturing the World 8th Edition
Larson8th EditionElementary Statistics: Picturing the WorldISBN: 9780137493470Non è quello che usi tu?Cambia libro di testo
Capitolo 9, Problema 9.2.9

"In Exercises 7-12, match the description in the left column with its symbol(s) in the right column.
9. Slope
a. \(\hat{y}\)_i
b. y_i
c. b
d. (\(\bar{x}\), \(\bar{y}\))
e. m
f. \(\bar{y}\)"

Guida verificata passo dopo passo
1
Step 1: Understand the context of the problem. The question asks to match the term 'Slope' with its corresponding symbol from a list of options. This is related to the concept of linear regression or the equation of a line in statistics.
Step 2: Recall the general form of the equation of a line used in statistics: y = b + mx, where m represents the slope of the line, and b is the y-intercept.
Step 3: Review each symbol option: \(\hat{y}\)_i is the predicted value of y, y_i is the observed value, b is typically the intercept, (\(\bar{x}\), \(\bar{y}\)) is the mean point, m is the slope, and \(\bar{y}\) is the mean of y values.
Step 4: Identify which symbol corresponds to the slope. Based on the equation and definitions, the slope is represented by m.
Step 5: Conclude that the correct match for 'Slope' is the symbol m.

Risposta video verificata per un problema simile:

Questa soluzione video è stata consigliata dai nostri tutor come utile per risolvere questo problema.
Durata del video:
3m

Concetti chiave

Ecco i concetti essenziali che devi comprendere per rispondere correttamente alla domanda.

Slope in Linear Regression

The slope represents the rate of change of the dependent variable with respect to the independent variable in a linear relationship. It quantifies how much y changes for a one-unit increase in x. In regression equations, the slope is often denoted by symbols like m or b, depending on context.
Video consigliato:
Percorso guidato
07:01
Intro to Least Squares Regression

Regression Equation Components

A simple linear regression equation is typically written as ŷ = b0 + b1x, where ŷ is the predicted value, b0 is the intercept, and b1 is the slope. Understanding these components helps in matching symbols like ŷ (predicted value) and b (slope or coefficient) to their descriptions.
Video consigliato:
Percorso guidato
07:01
Intro to Least Squares Regression

Sample Means and Observed Values

Sample means (denoted as x and y) represent average values of variables x and y, while observed values (y_i) are actual data points. Distinguishing between these helps in correctly associating symbols like (x, y) for means and y_i for observed values.
Video consigliato:
Percorso guidato
06:53
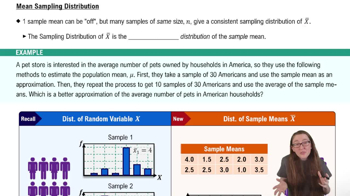
Sampling Distribution of Sample Mean
Pratica correlata
Domanda del libro di testo

"[APPLET] Registered Nurse Salaries In Exercises 27–30, use the table, which shows the years of experience of 14 registered nurses and their annual salaries (in thousands of dollars). (Adapted from Payscale, Inc.)

27. Correlation Using the scatter plot of the registered nurse salary data shown below, what type of correlation, if any, do you think the data have? Explain.


"

82
views
Domanda del libro di testo

"Predicting y-Values In Exercises 3-6, use the multiple regression equation to predict the y-values for the values of the independent variables.

6. Elephant Weight The equation used to predict the weight of an elephant (in kilograms) is

y =- 4016+11.5x_1+7.55x_2+12.5x_3

where x_1 represents the girth of the elephant (in centimeters), x_2 represents the length of the elephant (in centimeters), and x_3 represents the circumference of a footpad (in

centimeters). (Source: Field Trip Earth)

a. x_1 = 421, x_2 = 224, x_3 = 144

b. x_1 = 311, x_2 = 171, x_3 = 102

c. x_1 = 376, x_2 = 226, x_3 = 124

d. x_1 =231, x_2 = 135, x_3 = 86"

36
views
Domanda del libro di testo

"In Exercises 19-22, two variables are given that have been shown to have correlation but no cause-and-effect relationship. Describe at least one possible reason for the correlation.

22. Marriage rate in Kentucky and number of deaths caused by falling out of a fishing boat"

65
views
Domanda del libro di testo

8. In your own words, what does it mean to say "correlation does not imply causation"? List a pair of variables that have correlation but no cause-and-effect relationship.

141
views
Domanda del libro di testo

In Exercise 25, remove the data for the international soccer player with a maximum weight of 170 kilograms and a jump height of 64 centimeters. Describe how this affects the correlation coefficient r.

42
views
Domanda del libro di testo

"In Exercises 7-12, match the description in the left column with its symbol(s) in the right column.

12. The point a regression line always passes through

a. \(\hat{y}\)_i

b. y_i

c. b

d. (\(\bar{x}\), \(\bar{y}\))

e. m

f. \(\bar{y}\)"

51
views