

Ch. 10 - Correlation and Regression
Triola - Elementary Statistics 14th Edition
Triola14th EditionElementary StatisticsISBN: 9780137366446Non è quello che usi tu?Cambia libro di testo
Capitolo 10, Problema 10.2.19

Regression and Predictions
Exercises 13–28 use the same data sets as Exercises 13–28 in Section 10-1.


Find the regression equation, letting the first variable be the predictor (x) variable.
Find the indicated predicted value by following the prediction procedure summarized in Figure 10-5.


Oscars Listed below are ages of recent Oscar winners matched by the years in which the awards were won (from Data Set 21 “Oscar Winner Age” in Appendix B). Find the best predicted age of an Oscar-winning actress given that the Oscar winner for best actor is 59 years of age. How does the result compare to the actual actress age of 60 years?


[IMAGE]

Guida verificata passo dopo passo
1
Step 1: Understand the problem. You are tasked with finding the regression equation using the given data set, where the first variable (actor's age) is the predictor variable (x), and the second variable (actress's age) is the response variable (y). Then, use the regression equation to predict the actress's age when the actor's age is 59.
Step 2: Calculate the regression equation. The regression equation is typically of the form y = mx + b, where m is the slope and b is the y-intercept. To find m, use the formula m = (Σ(xy) - n(μx)(μy)) / (Σ(x²) - n(μx²)), where Σ represents summation, n is the number of data points, μx is the mean of x values, and μy is the mean of y values. To find b, use the formula b = μy - m(μx).
Step 3: Substitute the given data into the formulas for m and b. Use the ages of Oscar winners provided in the data set to calculate the slope (m) and y-intercept (b). Ensure you compute the necessary summations and means accurately.
Step 4: Write the regression equation using the calculated values of m and b. The equation will take the form y = mx + b, where x represents the actor's age and y represents the predicted actress's age.
Step 5: Use the regression equation to predict the actress's age when the actor's age is 59. Substitute x = 59 into the regression equation and solve for y. Compare the predicted value to the actual actress's age of 60 years to evaluate the accuracy of the prediction.

Risposta video verificata per un problema simile:

Questa soluzione video è stata consigliata dai nostri tutor come utile per risolvere questo problema.
Durata del video:
5m

Concetti chiave

Ecco i concetti essenziali che devi comprendere per rispondere correttamente alla domanda.

Regression Analysis

Regression analysis is a statistical method used to model the relationship between a dependent variable and one or more independent variables. In this context, it helps to determine how the age of Oscar-winning actresses can be predicted based on the age of Oscar-winning actors. The regression equation provides a mathematical representation of this relationship, allowing for predictions based on observed data.

Predictor and Response Variables

In regression analysis, the predictor variable (independent variable) is the one used to predict the value of another variable, known as the response variable (dependent variable). In this case, the age of the best actor (59 years) serves as the predictor variable, while the age of the best actress is the response variable we aim to estimate. Understanding the roles of these variables is crucial for interpreting regression results.
Video consigliato:
Percorso guidato
07:09
Intro to Random Variables & Probability Distributions

Prediction Procedure

The prediction procedure involves using the regression equation to estimate the value of the response variable based on a given value of the predictor variable. This typically includes substituting the predictor value into the regression equation to calculate the predicted response. In this scenario, the procedure will yield the predicted age of an Oscar-winning actress based on the age of the best actor, allowing for comparison with the actual age.
Video consigliato:
Percorso guidato
03:50
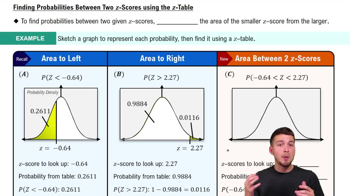
Probabilities Between Two Values
Pratica correlata
Domanda del libro di testo

Large Data Sets

Exercises 29–32 use the same Appendix B data sets as Exercises 29–32 in Section 10-1. In each case, find the regression equation, letting the first variable be the predictor (x) variable. Find the indicated predicted values following the prediction procedure summarized in Figure 10-5.

Taxis Repeat Exercise 16 using all of the distance/tip data from the 703 taxi rides listed in Data Set 32 “Taxis” from Appendix B.

212
views
Domanda del libro di testo

Interpreting the Coefficient of Determination

In Exercises 5–8, use the value of the linear correlation coefficient r to find the coefficient of determination and the percentage of the total variation that can be explained by the linear relationship between the two variables.

Times of Taxi Rides and Tips r = 0.298 (x = time in minutes, y = the amount of tip in dollars)

186
views
Domanda del libro di testo

Large Data Sets

Exercises 29–32 use the same Appendix B data sets as Exercises 29–32 in Section 10-1. In each case, find the regression equation, letting the first variable be the predictor (x) variable. Find the indicated predicted values following the prediction procedure summarized in Figure 10-5.

Taxis Repeat Exercise 15 using all of the time/tip data from the 703 taxi rides listed in Data Set 32 “Taxis” from Appendix B.

208
views
Domanda del libro di testo

Response and Predictor Variables Using all of the Tour de France bicycle race results up to a recent year, we get this multiple regression equation: Speed = 29.2-0.00260Distance + 0.540Stages + 0.0570Finishers, where Speed is the mean speed of the winner (km/h), Distance is the length of the race (km), Stages is the number of stages in the race, and Finishers is the number of bicyclists who finished the race. Identify the response and predictor variables.

226
views
Domanda del libro di testo

Correlation and Slope What is the relationship between the linear correlation coefficient r and the slope b1 of a regression line?

351
views
Domanda del libro di testo

Finding the Equation of the Regression Line

In Exercises 9 and 10, use the given data to find the equation of the regression line. Examine the scatterplot and identify a characteristic of the data that is ignored by the regression line.


[IMAGE]

403
views