




Ch. 12 - Analysis of Variance
Triola - Elementary Statistics 14th Edition
Triola14th EditionElementary StatisticsISBN: 9780137366446Non è quello che usi tu?Cambia libro di testo
Capitolo 12, Problema 12.1.18c

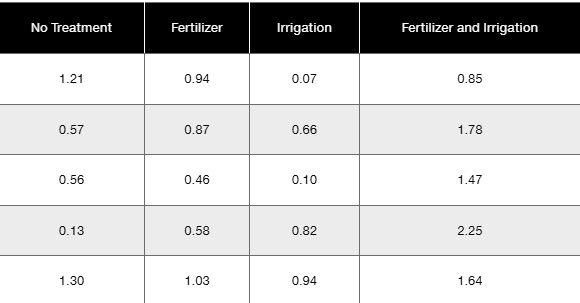
Bonferroni Test Shown below are weights (kg) of poplar trees obtained from trees planted in a rich and moist region. The trees were given different treatments identified in the table below. The data are from a study conducted by researchers at Pennsylvania State University and were provided by Minitab, Inc. Also shown are partial results from using the Bonferroni test with the sample data.

c. Use the Bonferroni test procedure with a 0.05 significance level to test for a significant difference between the mean amount of the irrigation treatment group and the group treated with both fertilizer and irrigation. Identify the test statistic and either the P-value or critical values. What do the results indicate?
Table showing Bonferroni test results comparing treatments with mean differences, standard errors, significance, and confidence intervals.

Guida verificata passo dopo passo
1
Step 1: Identify the two treatment groups to compare. Here, we are comparing the 'Irrigation' group (treatment 3) and the 'Fertilizer and Irrigation' group (treatment 4).
Step 2: Locate the mean difference between these two groups from the Bonferroni test table. The mean difference is given as -0.84400, which represents the difference in average weights between the 'Irrigation' group and the 'Fertilizer and Irrigation' group.
Step 3: Note the standard error associated with this mean difference, which is 0.26955. This value measures the variability of the difference estimate.
Step 4: Check the significance value (Sig.) for this comparison, which is 0.039. This is the P-value used to determine if the difference is statistically significant at the 0.05 significance level.
Step 5: Interpret the results: Since the P-value (0.039) is less than the significance level (0.05), we reject the null hypothesis that there is no difference between the two treatment means. The 95% confidence interval for the mean difference is from -1.6549 to -0.0331, which does not include zero, further supporting a significant difference.

Risposta video verificata per un problema simile:

Questa soluzione video è stata consigliata dai nostri tutor come utile per risolvere questo problema.
Durata del video:
2m

Concetti chiave

Ecco i concetti essenziali che devi comprendere per rispondere correttamente alla domanda.

Bonferroni Test

The Bonferroni test is a multiple comparison procedure used after an ANOVA to control the overall Type I error rate when making pairwise comparisons. It adjusts the significance level by dividing it by the number of comparisons, ensuring that the probability of making one or more false discoveries remains low. This test helps identify which specific group means differ significantly.
Video consigliato:
Percorso guidato
06:28
Independence Test

Test Statistic and P-value

The test statistic measures the difference between group means relative to the variability in the data. The P-value indicates the probability of observing such a difference if the null hypothesis is true. In the Bonferroni test, comparing the test statistic to critical values or the P-value to the adjusted significance level determines if the difference is statistically significant.
Video consigliato:
Percorso guidato
06:50
Step 3: Get P-Value

Confidence Intervals in Multiple Comparisons

Confidence intervals in the Bonferroni test are adjusted to maintain the overall confidence level across multiple comparisons. These intervals provide a range of plausible values for the difference between group means. If the interval does not include zero, it suggests a significant difference between the groups at the chosen significance level.
Video consigliato:
Percorso guidato
06:33
Introduction to Confidence Intervals