


Ch. 12 - Analysis of Variance
Triola - Elementary Statistics 14th Edition
Triola14th EditionElementary StatisticsISBN: 9780137366446Non è quello che usi tu?Cambia libro di testo
Capitolo 12, Problema 12.2.5

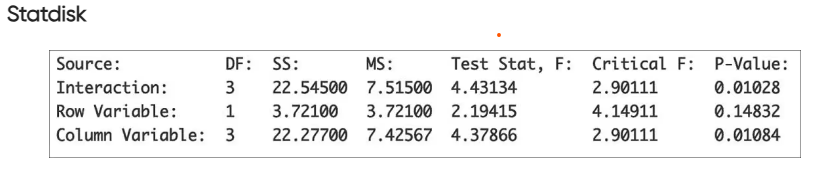
Car Crash Test Measurements If we use the data given in Exercise 1 with two-way analysis of variance and a 0.05 significance level, we get the accompanying display. What do you conclude?
"ANOVA table with sources: Interaction, Row, Column; showing DF, SS, MS, Test Stat, Critical F, and P-Value."

Guida verificata passo dopo passo
1
Step 1: Understand the context of the problem. This is a two-way ANOVA test, which is used to analyze the effect of two independent variables (factors) on a dependent variable, as well as their interaction. The table provides the results of the analysis, including degrees of freedom (DF), sum of squares (SS), mean square (MS), F-statistic, critical F-value, and P-value for each source of variation.
Step 2: Interpret the interaction row. The interaction term tests whether the two factors interact significantly. Compare the P-value (0.01028) to the significance level (0.05). If the P-value is less than 0.05, conclude that there is a significant interaction effect between the two factors.
Step 3: Interpret the row variable. This term tests the main effect of the row variable (one of the factors). Compare the P-value (0.14832) to the significance level (0.05). If the P-value is greater than 0.05, conclude that the row variable does not have a significant main effect.
Step 4: Interpret the column variable. This term tests the main effect of the column variable (the other factor). Compare the P-value (0.01084) to the significance level (0.05). If the P-value is less than 0.05, conclude that the column variable has a significant main effect.
Step 5: Summarize the conclusions. Based on the P-values, there is a significant interaction effect between the two factors, no significant main effect for the row variable, and a significant main effect for the column variable. These conclusions should guide further analysis or decision-making.

Risposta video verificata per un problema simile:

Questa soluzione video è stata consigliata dai nostri tutor come utile per risolvere questo problema.
Durata del video:
6m

Concetti chiave

Ecco i concetti essenziali che devi comprendere per rispondere correttamente alla domanda.

Two-Way ANOVA

Two-way ANOVA is a statistical method used to determine the effect of two independent categorical variables on a continuous dependent variable. It assesses not only the individual impact of each factor but also the interaction between them. This technique helps in understanding how different groups compare and whether their means are significantly different.
Video consigliato:
Percorso guidato
03:50
Probabilities Between Two Values

F-Statistic

The F-statistic is a ratio used in ANOVA to compare the variance between group means to the variance within the groups. A higher F-statistic indicates a greater disparity between the group means relative to the variability within the groups, suggesting that at least one group mean is significantly different from the others. It is crucial for determining the significance of the results.
Video consigliato:
Percorso guidato
05:53
Parameters vs. Statistics

P-Value

The p-value is a measure that helps determine the significance of the results in hypothesis testing. It indicates the probability of observing the data, or something more extreme, assuming the null hypothesis is true. A p-value less than the significance level (e.g., 0.05) suggests that the null hypothesis can be rejected, indicating a statistically significant effect.
Video consigliato:
Percorso guidato
06:50
Step 3: Get P-Value
Pratica correlata
Domanda del libro di testo

Two-Way Anova If we have a goal of using the data given in Exercise 1 to (1) determine whether the femur side (left, right) has an effect on the crash force measurements and (2) to determine whether the vehicle size has an effect on the crash force measurements, should we use one-way analysis of variance for the two individual tests? Why or why not?

169
views
Domanda del libro di testo

Weights from ANSUR I and ANSUR II The following table lists weights (kg) of randomly selected U.S. Army personnel obtained from the ANSUR I study conducted in 1988 and the ANSUR II study conducted in 2012. If we use the data with two-way analysis of variance and a 0.05 significance level, we get the accompanying display. What do you conclude?

56
views
Domanda del libro di testo

Distance Between Pupils The following table lists distances (mm) between pupils of randomly selected U.S. Army personnel collected as part of the ANSUR II study. Results from two-way analysis of variance are also shown. Use the displayed results and use a 0.05 significance level. What do you conclude? Are the results as you would expect?

132
views
Domanda del libro di testo

Pancake Experiment Listed below are ratings of pancakes made by experts (based on data from Minitab). Different pancakes were made with and without a supplement and with different amounts of whey. The results from two-way analysis of variance are shown. Use the displayed results and a 0.05 significance level. What do you conclude?

44
views
Domanda del libro di testo

Two-Way Anova The measurements of crash test forces on the femur in Table 12-3 from Example 1 are reproduced below with fabricated measurement data (in red) used for the left femur in a small car. What characteristic of the data suggests that the appropriate method of analysis is two-way analysis of variance? That is, what is “two-way” about the data entered in this table?

132
views
Domanda del libro di testo

Tukey Test A display of the Bonferroni test results from Table 12-1 (which is part of the Chapter Problem) is provided here. Shown on the top of the next page is the SPSS-generated display of results from the Tukey test using the same data. Compare the Tukey test results to those from the Bonferroni test.

32
views