Ch. 2 - Exploring Data with Tables and Graphs
Triola - Elementary Statistics 14th Edition
Triola14th EditionElementary StatisticsISBN: 9780137366446Non è quello che usi tu?Cambia libro di testo
Capitolo 2, Problema 2.q.2

Tornado Alley Using the same frequency distribution from Exercise 1, identify the class limits of the first class and the class boundaries of the first class.
Table showing annual tornado frequency in Oklahoma, with class limits and corresponding frequencies for each range.

Guida verificata passo dopo passo
1
Step 1: Identify the class limits of the first class. The class limits are the smallest and largest data values that can belong to a class. For the first class, the range is 0–19. Therefore, the lower class limit is 0, and the upper class limit is 19.
Step 2: Understand the concept of class boundaries. Class boundaries are the values that separate one class from another. They are calculated by finding the midpoint between the upper limit of one class and the lower limit of the next class.
Step 3: Calculate the lower class boundary of the first class. To find this, subtract 0.5 from the lower class limit of the first class. The lower class limit is 0, so the lower class boundary is 0 - 0.5 = -0.5.
Step 4: Calculate the upper class boundary of the first class. To find this, add 0.5 to the upper class limit of the first class. The upper class limit is 19, so the upper class boundary is 19 + 0.5 = 19.5.
Step 5: Summarize the results. The class limits of the first class are 0 and 19, and the class boundaries of the first class are -0.5 and 19.5.

Risposta video verificata per un problema simile:

Questa soluzione video è stata consigliata dai nostri tutor come utile per risolvere questo problema.
Durata del video:
2m

Concetti chiave

Ecco i concetti essenziali che devi comprendere per rispondere correttamente alla domanda.

Class Limits

Class limits refer to the smallest and largest values that define a class interval in a frequency distribution. For example, in the interval '0-19', the lower class limit is 0 and the upper class limit is 19. Understanding class limits is essential for organizing data into meaningful intervals, which helps in analyzing the distribution of data points.
Video consigliato:
Percorso guidato
06:29
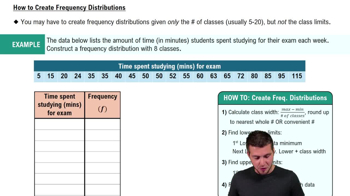
How to Create Frequency Distributions

Class Boundaries

Class boundaries are the values that separate one class from another in a frequency distribution, ensuring there are no gaps between classes. They are typically calculated by taking the average of the upper limit of one class and the lower limit of the next. For instance, the class boundaries for the '0-19' class would be 19.5 and 0.5, allowing for a clear transition to the next class.
Video consigliato:
Percorso guidato
07:10
How to Create Histogram - TI-84 Calculator

Frequency Distribution

A frequency distribution is a summary of how often each value or range of values occurs in a dataset. It is typically presented in a table format, showing class intervals alongside their corresponding frequencies. This concept is crucial for visualizing data patterns and making statistical inferences, such as identifying trends in tornado occurrences in Oklahoma.
Video consigliato:
Percorso guidato
06:38
Intro to Frequency Distributions
Pratica correlata
Domanda del libro di testo

Interpreting Normal Quantile Plots Which of the following normal quantile plots appear to represent data from a population having a normal distribution? Explain.

204
views

Domanda del libro di testo

Tornado Alley Refer to the accompanying frequency distribution that summarizes the number of tornadoes in Oklahoma in each year for the past several years. What is the class width? Is it possible to identify the original data values?

134
views
Domanda del libro di testo

In Exercises 1–5, use the data listed in the margin, which are magnitudes (Richter scale) and depths (km) of earthquakes from Data Set 24 “Earthquakes” in Appendix B


Histogram Construct the histogram corresponding to the frequency distribution from Exercise 1. For the values on the horizontal axis, use the class midpoint values. Which of the following comes closest to describing the distribution: uniform, normal, skewed left, skewed right?


113
views
Domanda del libro di testo

Estimating r For each of the following, estimate the value of the linear correlation coefficient r for the given paired data obtained from 50 randomly selected adults.


d. The 50 adults all drove cars from Jacksonville, Florida, to Richmond, Virginia. Their average (mean) speeds are recorded along with the times it took to complete that trip.

147
views
Domanda del libro di testo

Histogram of Interarrival Times Construct the histogram that corresponds to the frequency distribution from Exercise 1. Use class midpoint values for the horizontal scale. Does the histogram suggest that the data are from a population having a normal distribution? Why or why not?

185
views
Domanda del libro di testo

Tornado Alley Construct the relative frequency distribution corresponding to the frequency distribution in Exercise 1

146
views