


Ch. 3 - Describing, Exploring, and Comparing Data
Triola - Elementary Statistics 14th Edition
Triola14th EditionElementary StatisticsISBN: 9780137366446Non è quello che usi tu?Cambia libro di testo
Capitolo 3, Problema 3.2.26

Large Data Sets from Appendix B. In Exercises 25–28, refer to the indicated data set in Appendix B. Use software or a calculator to find the range, variance, and standard deviation. Express answers using appropriate units, such as “minutes.”


Earthquakes Use the magnitudes (Richter scale) of the 600 earthquakes listed in Data Set 24 “Earthquakes” in Appendix B. In 1989, the San Francisco Bay Area was struck with an earthquake that measured 7.0 on the Richter scale. If we add that value of 7.0 to those listed in the data set, do the measures of variation change much?

Guida verificata passo dopo passo
1
Step 1: Understand the problem. You are tasked with calculating the range, variance, and standard deviation of the magnitudes of 600 earthquakes from Data Set 24. Additionally, you need to assess how adding a new value (7.0) affects these measures of variation.
Step 2: Calculate the range. The range is the difference between the maximum and minimum values in the data set. Use software or a calculator to identify the maximum and minimum magnitudes in the original data set, then compute the range as: Range=Max-Min.
Step 3: Calculate the variance. Variance measures the average squared deviation from the mean. Use the formula: σ2=∑(x-μ)2n, where μ is the mean, x represents each data point, and n is the number of data points. Use software or a calculator to compute this.
Step 4: Calculate the standard deviation. The standard deviation is the square root of the variance. Use the formula: σ=σ2. Use software or a calculator to compute this value.
Step 5: Assess the impact of adding 7.0. Add the value 7.0 to the data set and recalculate the range, variance, and standard deviation. Compare the new values to the original ones to determine if the measures of variation change significantly. Consider how the new value affects the spread and distribution of the data.

Risposta video verificata per un problema simile:

Questa soluzione video è stata consigliata dai nostri tutor come utile per risolvere questo problema.
Durata del video:
11m

Concetti chiave

Ecco i concetti essenziali che devi comprendere per rispondere correttamente alla domanda.

Range

The range is a measure of dispersion that indicates the difference between the maximum and minimum values in a data set. It provides a simple way to understand the spread of data points, but it can be sensitive to outliers, which may skew the perception of variability.
Video consigliato:
Percorso guidato
05:45
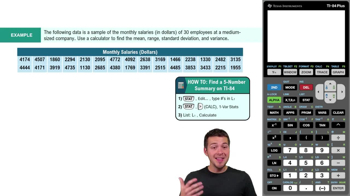
Find 5-Number Summary - TI-84 Calculator Example 1

Variance and Standard Deviation

Variance quantifies the degree to which data points differ from the mean, while standard deviation is the square root of variance, providing a measure of spread in the same units as the data. Both metrics are essential for understanding the distribution of data and how much individual data points deviate from the average.
Video consigliato:
Percorso guidato
08:45
Calculating Standard Deviation

Impact of Outliers

Outliers are data points that significantly differ from other observations in a dataset. Their presence can greatly affect measures of central tendency and variability, such as the mean, variance, and standard deviation, leading to potentially misleading interpretations of the data's overall characteristics.
Video consigliato:
Percorso guidato
04:48
Comparing Mean vs. Median
Pratica correlata
Domanda del libro di testo

Boxplots. In Exercises 29–32, use the given data to construct a boxplot and identify the 5-number summary.


Taxis Listed below are times (minutes) of a sample of taxi rides in New York City. The data are from the New York City Taxi and Limousine Commission.

15123131133624

138
views
Domanda del libro di testo

In Exercises 5–20, find the range, variance, and standard deviation for the given sample data. Include appropriate units (such as “minutes”) in your results. (The same data were used in Section 3-1, where we found measures of center. Here we find measures of variation.) Then answer the given questions.


California Smokers In the California Health Interview Survey, randomly selected adults are interviewed. One of the questions asks how many cigarettes are smoked per day, and results are listed below for 50 randomly selected respondents. How well do the results reflect the smoking behavior of California adults?


[IMAGE]

225
views
Domanda del libro di testo

Weighted Mean A student of the author earned grades of 63, 91, 88, 84, and 79 on her five regular statistics tests. She earned grades of 86 on the final exam and 90 on her class projects. Her combined homework grade was 70. The five regular tests count for 60% of the final grade, the final exam counts for 10%, the project counts for 15%, and homework counts for 15%. What is her weighted mean grade? What letter grade did she earn (A, B, C, D, or F)? Assume that a mean of 90 or above is an A, a mean of 80 to 89 is a B, and so on.

209
views