



Ch. 5 - Discrete Probability Distributions
Triola - Elementary Statistics 14th Edition
Triola14th EditionElementary StatisticsISBN: 9780137366446Non è quello che usi tu?Cambia libro di testo
Capitolo 5, Problema 5.RE.6

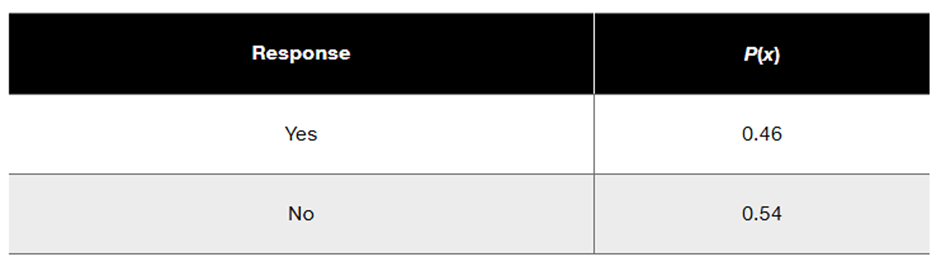
Acrophobia USA Today reported results from a survey in which subjects were asked if they are afraid of heights in tall buildings. The results are summarized in the accompanying table. Does this table describe a probability distribution? Why or why not?
Table showing survey responses: "Yes" with probability 0.46 and "No" with probability 0.54.

Guida verificata passo dopo passo
1
Step 1: Understand the concept of a probability distribution. A probability distribution must satisfy two conditions: (1) The sum of all probabilities must equal 1, and (2) each probability value must be between 0 and 1 inclusive.
Step 2: Examine the table provided. The table lists two responses ('Yes' and 'No') along with their corresponding probabilities P(x): 0.46 for 'Yes' and 0.54 for 'No'.
Step 3: Verify the first condition of a probability distribution. Add the probabilities: P(Yes) + P(No) = 0.46 + 0.54. Check if the sum equals 1.
Step 4: Verify the second condition of a probability distribution. Ensure that each probability value (0.46 and 0.54) lies within the range [0, 1].
Step 5: Based on the results of the verification steps, determine whether the table satisfies both conditions of a probability distribution and explain why or why not.

Risposta video verificata per un problema simile:

Questa soluzione video è stata consigliata dai nostri tutor come utile per risolvere questo problema.
Durata del video:
3m

Concetti chiave

Ecco i concetti essenziali che devi comprendere per rispondere correttamente alla domanda.

Probability Distribution

A probability distribution describes how the probabilities of a random variable are distributed across its possible values. For a valid probability distribution, the sum of all probabilities must equal 1, and each individual probability must be between 0 and 1. In the context of the survey, the responses 'Yes' and 'No' with their respective probabilities must satisfy these conditions.
Video consigliato:
Percorso guidato
06:39
Calculating Probabilities in a Binomial Distribution

Random Variable

A random variable is a numerical outcome of a random phenomenon. In this case, the random variable could be defined as the response to the question of whether individuals are afraid of heights. The responses 'Yes' and 'No' represent the possible outcomes of this random variable, which can be analyzed using probability distributions.
Video consigliato:
Percorso guidato
07:09
Intro to Random Variables & Probability Distributions

Sum of Probabilities

The sum of probabilities in a probability distribution must equal 1, reflecting the certainty that one of the possible outcomes will occur. In the provided table, the probabilities for 'Yes' (0.46) and 'No' (0.54) add up to 1 (0.46 + 0.54 = 1.00), confirming that the table represents a valid probability distribution.
Video consigliato:
Percorso guidato
5:37
Introduction to Probability
Pratica correlata
Domanda del libro di testo

Poisson: Deaths Currently, an average of 7 residents of the village of Westport (population 760) die each year (based on data from the U.S. National Center for Health Statistics).


b. Find the probability that on a given day, there are no deaths.

137
views
Domanda del libro di testo

Poisson: Deaths Currently, an average of 7 residents of the village of Westport (population 760) die each year (based on data from the U.S. National Center for Health Statistics).


c. Find the probability that on a given day, there is more than one death.


145
views
Domanda del libro di testo

In Exercises 1–5, assume that 4.2% of workers test positive when tested for illegal drugs (based on data from Quest Diagnostics). Assume that a group of ten workers is randomly selected.


Workplace Drug Testing If four of the ten workers test positive for illegal drugs, is that a significantly high result?

112
views
Domanda del libro di testo

In Exercises 5–8, assume that the Poisson distribution applies; assume that the mean number of Atlantic hurricanes in the United States is 5.5 per year, as in Example 1; and proceed to find the indicated probability.

a. Find the probability that in a year, there will be 10 hurricanes.

195
views
Domanda del libro di testo

Family/Partner Groups of people aged 15–65 are randomly selected and arranged in groups of six. The random variable x is the number in the group who say that their family and/or partner contribute most to their happiness (based on a Coca-Cola survey). The accompanying table lists the values of x along with their corresponding probabilities. Does the table describe a probability distribution? If so, find the mean and standard deviation.


153
views
Domanda del libro di testo

In Exercises 5–8, assume that the Poisson distribution applies; assume that the mean number of Atlantic hurricanes in the United States is 5.5 per year, as in Example 1; and proceed to find the indicated probability.

a. Find the probability that in a year, there will be no hurricanes.

158
views