

Ch. 5 - Discrete Probability Distributions
Triola - Elementary Statistics 14th Edition
Triola14th EditionElementary StatisticsISBN: 9780137366446Non è quello che usi tu?Cambia libro di testo
Capitolo 5, Problema 6b

 In Exercises 5–8, assume that the Poisson distribution applies; assume that the mean number of Atlantic hurricanes in the United States is 5.5 per year, as in Example 1; and proceed to find the indicated probability.


Hurricanes


b. In a 118-year period, how many years are expected to have no hurricanes?

Guida verificata passo dopo passo
1
Step 1: Understand the problem. The Poisson distribution is used to model the number of events (hurricanes) occurring in a fixed interval of time (years). The mean number of hurricanes per year is given as λ = 5.5. We are tasked with finding the expected number of years with no hurricanes over a 118-year period.
Step 2: Recall the formula for the Poisson probability mass function (PMF): P(X = k) = (λ^k * e^(-λ)) / k!, where X is the number of events, λ is the mean number of events, k is the specific number of events (in this case, k = 0 for no hurricanes), and e is the base of the natural logarithm.
Step 3: Calculate the probability of having no hurricanes in a single year using the Poisson PMF. Substitute λ = 5.5 and k = 0 into the formula: P(X = 0) = (5.5^0 * e^(-5.5)) / 0!. Simplify the expression, noting that 0! = 1 and 5.5^0 = 1.
Step 4: Once the probability of no hurricanes in a single year is determined, multiply this probability by the total number of years (118) to find the expected number of years with no hurricanes. Use the formula: Expected years = P(X = 0) * 118.
Step 5: Interpret the result. The final value represents the expected number of years out of 118 that will have no hurricanes, based on the given mean of 5.5 hurricanes per year.

Risposta video verificata per un problema simile:

Questa soluzione video è stata consigliata dai nostri tutor come utile per risolvere questo problema.
Durata del video:
2m

Concetti chiave

Ecco i concetti essenziali che devi comprendere per rispondere correttamente alla domanda.

Poisson Distribution

The Poisson distribution is a probability distribution that expresses the probability of a given number of events occurring in a fixed interval of time or space, given a known average rate of occurrence. It is particularly useful for modeling rare events, such as natural disasters, where the events are independent of each other.
Video consigliato:
Percorso guidato
06:38
Intro to Frequency Distributions

Expected Value

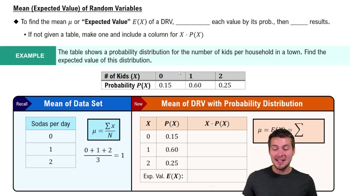
The expected value is a key concept in probability that represents the average outcome of a random variable over a large number of trials. In the context of the Poisson distribution, the expected number of occurrences can be calculated by multiplying the average rate (mean) by the number of intervals considered.
Video consigliato:
Percorso guidato
04:14
Expected Value (Mean) of Random Variables

Probability of No Events

In a Poisson distribution, the probability of observing zero events in a given interval can be calculated using the formula P(X=0) = e^(-λ), where λ is the mean number of events. This concept is crucial for determining how many years in a specified period are expected to have no hurricanes, based on the average rate.
Video consigliato:
Percorso guidato
05:54
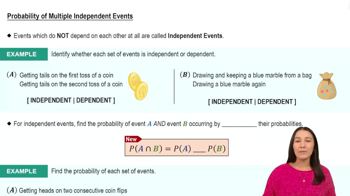
Probability of Multiple Independent Events
Pratica correlata
Domanda del libro di testo

In Exercises 6–10, refer to the accompanying table, which describes the numbers of adults in groups of five who reported sleepwalking (based on data from “Prevalence and Comorbidity of Nocturnal Wandering In the U.S. Adult General Population,” by Ohayon et al., Neurology, Vol. 78, No. 20).


Probability Find the probability that at least one of the subjects is a sleepwalker.

158
views
Domanda del libro di testo

Texting and Driving. In Exercises 21–26, refer to the accompanying table, which describes probabilities for groups of five drivers. The random variable x is the number of drivers in a group who say that they text while driving (based on data from an Arity survey of drivers).

For groups of five drivers, find the mean and standard deviation for the numbers of drivers who say that they text while driving.

82
views
Domanda del libro di testo

 In Exercises 5–8, assume that the Poisson distribution applies; assume that the mean number of Atlantic hurricanes in the United States is 5.5 per year, as in Example 1; and proceed to find the indicated probability.


Hurricanes


a. Find the probability that in a year, there will be no hurricanes.

141
views
Domanda del libro di testo

Texting and Driving. In Exercises 21–26, refer to the accompanying table, which describes probabilities for groups of five drivers. The random variable x is the number of drivers in a group who say that they text while driving (based on data from an Arity survey of drivers).

Using Probabilities for Significant Events


b. Find the probability of getting 3 or more drivers who say that they text while driving.

117
views
Domanda del libro di testo

Texting and Driving. In Exercises 21–26, refer to the accompanying table, which describes probabilities for groups of five drivers. The random variable x is the number of drivers in a group who say that they text while driving (based on data from an Arity survey of drivers).

Range Rule of Thumb for Significant Events

Use the range rule of thumb to determine whether 1 is a significantly low number of drivers who say that they text while driving.

107
views
Domanda del libro di testo

In Exercises 6–10, refer to the accompanying table, which describes the numbers of adults in groups of five who reported sleepwalking (based on data from “Prevalence and Comorbidity of Nocturnal Wandering In the U.S. Adult General Population,” by Ohayon et al., Neurology, Vol. 78, No. 20).


Does the table describe a probability distribution?

187
views