

Ch. 5 - Discrete Probability Distributions
Triola - Elementary Statistics 14th Edition
Triola14th EditionElementary StatisticsISBN: 9780137366446Non è quello che usi tu?Cambia libro di testo
Capitolo 5, Problema 5.3.7b

In Exercises 5–8, assume that the Poisson distribution applies; assume that the mean number of Atlantic hurricanes in the United States is 5.5 per year, as in Example 1; and proceed to find the indicated probability.
b. In a 118-year period, how many years are expected to have no hurricanes?

Guida verificata passo dopo passo
1
Understand the problem: The Poisson distribution is used to model the number of events (hurricanes) occurring in a fixed interval of time (years). The mean number of hurricanes per year is given as 5.5. We are tasked with finding the expected number of years with no hurricanes over a 118-year period.
Step 1: Recall the formula for the Poisson probability mass function (PMF): P(X = k) = (λ^k * e^(-λ)) / k!, where λ is the mean number of events, k is the number of events, and e is the base of the natural logarithm (approximately 2.718).
Step 2: For this problem, we are interested in the probability of having no hurricanes in a single year (k = 0). Substitute k = 0 and λ = 5.5 into the PMF formula: P(X = 0) = (5.5^0 * e^(-5.5)) / 0!. Simplify this expression, noting that 0! = 1 and 5.5^0 = 1.
Step 3: Once you calculate P(X = 0), interpret it as the probability of having no hurricanes in a single year. To find the expected number of years with no hurricanes over a 118-year period, multiply this probability by the total number of years: Expected years = P(X = 0) * 118.
Step 4: Perform the calculations step by step to determine the final expected number of years with no hurricanes. Ensure that you use accurate values for e^(-5.5) and complete the multiplication with 118 to arrive at the result.

Risposta video verificata per un problema simile:

Questa soluzione video è stata consigliata dai nostri tutor come utile per risolvere questo problema.
Durata del video:
3m

Concetti chiave

Ecco i concetti essenziali che devi comprendere per rispondere correttamente alla domanda.

Poisson Distribution

The Poisson distribution is a probability distribution that expresses the probability of a given number of events occurring in a fixed interval of time or space, given a known average rate of occurrence. It is particularly useful for modeling rare events, such as natural disasters, where the events are independent of each other.
Video consigliato:
Percorso guidato
06:38
Intro to Frequency Distributions

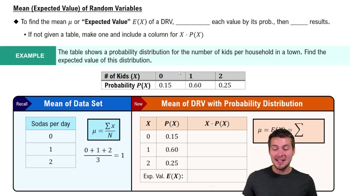
Expected Value

The expected value is a key concept in probability that represents the average outcome of a random variable over a large number of trials. In the context of the Poisson distribution, the expected number of occurrences can be calculated by multiplying the average rate (mean) by the number of intervals considered, providing a basis for predicting outcomes.
Video consigliato:
Percorso guidato
04:14
Expected Value (Mean) of Random Variables

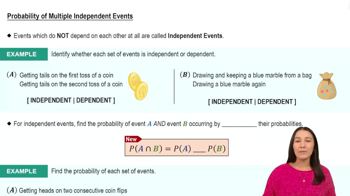
Probability of Zero Events

In a Poisson distribution, the probability of observing zero events in a given interval can be calculated using the formula P(X=0) = e^(-λ), where λ is the mean number of events. This concept is crucial for determining how many years in a specified period are expected to have no hurricanes, as it directly relates to the average rate of occurrence.
Video consigliato:
Percorso guidato
05:54
Probability of Multiple Independent Events
Pratica correlata
Domanda del libro di testo

In Exercises 29 and 30, assume that different groups of couples use the XSORT method of gender selection and each couple gives birth to one baby. The XSORT method is designed to increase the likelihood that a baby will be a girl, but assume that the method has no effect, so the probability of a girl is 0.5.


Gender Selection Assume that the groups consist of 36 couples.


b. Use the range rule of thumb to find the values separating results that are significantly low or significantly high.

91
views
Domanda del libro di testo

Lottery. In Exercises 15–20, refer to the accompanying table, which describes probabilities for the California Daily 4 lottery. The player selects four digits with repetition allowed, and the random variable x is the number of digits that match those in the same order that they are drawn (for a “straight” bet).


Using Probabilities for Significant Events


a. Find the probability of getting exactly 2 matches.

113
views
Domanda del libro di testo

 In Exercises 5–8, assume that the Poisson distribution applies; assume that the mean number of Atlantic hurricanes in the United States is 5.5 per year, as in Example 1; and proceed to find the indicated probability.


Hurricanes


a. Find the probability that in a year, there will be 7 hurricanes.

142
views
Domanda del libro di testo

In Exercises 5–8, assume that the Poisson distribution applies; assume that the mean number of Atlantic hurricanes in the United States is 5.5 per year, as in Example 1; and proceed to find the indicated probability.

b. In a 118-year period, how many years are expected to have 10 hurricanes?

128
views
Domanda del libro di testo

In Exercises 31 and 32, assume that hybridization experiments are conducted with peas having the property that for offspring, there is a 0.75 probability that a pea has green pods (as in one of Mendel’s famous experiments).


Hybrids Assume that offspring peas are randomly selected in groups of 16.


b. Use the range rule of thumb to find the values separating results that are significantly low or significantly high.

198
views
Domanda del libro di testo

One of Mendel’s famous experiments with peas resulted in 580 offspring, and 152 of them were yellow peas. Mendel claimed that under the same conditions, 25% of offspring peas would be yellow. Assume that Mendel’s claim of 25% is true, and assume that a sample consists of 580 offspring peas.


b. Find the probability of exactly 152 yellow peas.


111
views