


Ch. 6 - Normal Probability Distributions
Triola - Elementary Statistics 14th Edition
Triola14th EditionElementary StatisticsISBN: 9780137366446Non è quello che usi tu?Cambia libro di testo
Capitolo 6, Problema 6.CRE.2d

In Exercises 1 and 2, use the following wait times (minutes) at 10:00 AM for the Tower of Terror ride at Disney World (from Data Set 33 “Disney World Wait Times” in Appendix B).


35 35 20 50 95 75 45 50 30 35 30 30


d. The accompanying normal quantile plot is obtained by using all 50 wait times at 10:00 AM for the Tower of Terror ride at Disney World. Based on this normal quantile plot, do the sample data appear to be from a normally distributed population?
Normal quantile plot showing wait times for the Tower of Terror ride, assessing normal distribution of data points.

Guida verificata passo dopo passo
1
Step 1: Understand the purpose of a normal quantile plot. A normal quantile plot is used to assess whether a dataset follows a normal distribution. If the points in the plot closely follow a straight line, the data is likely from a normally distributed population.
Step 2: Examine the provided normal quantile plot. The plot shows the wait times (minutes) for the Tower of Terror ride at 10:00 AM, with Z-scores on the vertical axis and wait times on the horizontal axis. The orange line represents the expected linear relationship if the data were perfectly normal.
Step 3: Analyze the alignment of the data points with the orange line. In the plot, most of the data points closely follow the orange line, indicating a strong linear relationship. However, there are slight deviations at the extremes (lower and upper ends of the wait times).
Step 4: Interpret the deviations. The slight deviations at the extremes suggest that the data may not be perfectly normal, but the overall alignment with the line indicates that the data is approximately normal.
Step 5: Conclude based on the analysis. Based on the normal quantile plot, the sample data appears to be from a population that is approximately normally distributed, with minor deviations at the extremes.

Risposta video verificata per un problema simile:

Questa soluzione video è stata consigliata dai nostri tutor come utile per risolvere questo problema.
Durata del video:
2m

Concetti chiave

Ecco i concetti essenziali che devi comprendere per rispondere correttamente alla domanda.

Normal Distribution

A normal distribution is a probability distribution that is symmetric about the mean, showing that data near the mean are more frequent in occurrence than data far from the mean. It is characterized by its bell-shaped curve, defined by its mean and standard deviation. Understanding this concept is crucial for determining if a dataset follows a normal distribution, which is often a prerequisite for various statistical analyses.
Video consigliato:
Percorso guidato
03:17
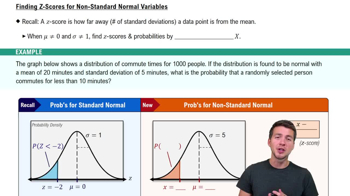
Finding Z-Scores for Non-Standard Normal Variables

Quantile Plot

A quantile plot, specifically a normal quantile plot, is a graphical tool used to assess if a dataset follows a normal distribution. It plots the quantiles of the data against the quantiles of a normal distribution. If the points in the plot closely follow a straight line, it suggests that the data are normally distributed. Deviations from this line indicate departures from normality.
Video consigliato:
Percorso guidato
07:38
Residuals and Residual Plots

Z-Score

A z-score is a statistical measurement that describes a value's relationship to the mean of a group of values. It is calculated by subtracting the mean from the value and then dividing by the standard deviation. Z-scores are essential in normal quantile plots as they standardize the data, allowing for comparison across different datasets and helping to identify how far a data point is from the mean in terms of standard deviations.
Video consigliato:
Percorso guidato
06:31
Z-Scores From Given Probability - TI-84 (CE) Calculator
Pratica correlata
Domanda del libro di testo

In Exercises 1 and 2, use the following wait times (minutes) at 10:00 AM for the Tower of Terror ride at Disney World (from Data Set 33 “Disney World Wait Times” in Appendix B).


35 35 20 50 95 75 45 50 30 35 30 30


b. Construct a boxplot.

139
views
Domanda del libro di testo

Mensa Membership in Mensa requires a score in the top 2% on a standard intelligence test. The Wechsler IQ test is designed for a mean of 100 and a standard deviation of 15, and scores are normally distributed.


b. If 4 randomly selected adults take the Wechsler IQ test, find the probability that their mean score is at least 131.

233
views
Domanda del libro di testo

Blue Eyes Assume that 35% of us have blue eyes (based on a study by Dr. P. Soria at Indiana University).


c. Find the probability of randomly selecting three different people and finding that all of them have blue eyes.

130
views
Domanda del libro di testo

In Exercises 1 and 2, use the following wait times (minutes) at 10:00 AM for the Tower of Terror ride at Disney World (from Data Set 33 “Disney World Wait Times” in Appendix B).


35 35 20 50 95 75 45 50 30 35 30 30


e. Convert the longest wait time to a z score.

f. Based on the result from part (e), is the longest wait time significantly high?

112
views
Domanda del libro di testo

Blue Eyes Assume that 35% of us have blue eyes (based on a study by Dr. P. Soria at Indiana University).


b. Find the value of P(B_bar).

152
views
Domanda del libro di testo

In Exercises 1 and 2, use the following wait times (minutes) at 10:00 AM for the Tower of Terror ride at Disney World (from Data Set 33 “Disney World Wait Times” in Appendix B).


35 35 20 50 95 75 45 50 30 35 30 30


a. Find the mean xbar.

106
views