

Ch. 8 - Hypothesis Testing
Triola - Elementary Statistics 14th Edition
Triola14th EditionElementary StatisticsISBN: 9780137366446Non è quello che usi tu?Cambia libro di testo
Capitolo 8, Problema 8.CR.6

Lightning Deaths The graph in Cumulative Review Exercise 5 was created by using data consisting of 242 male deaths from lightning strikes and 64 female deaths from lightning strikes. Assume that these data are randomly selected lightning deaths and proceed to test the claim that the proportion of male deaths is greater than . Use a 0.01 significance level. Any explanation for the result?

Guida verificata passo dopo passo
1
State the null hypothesis (H₀) and the alternative hypothesis (H₁). The null hypothesis is H₀: p₁ ≤ p₂ (the proportion of male deaths is less than or equal to the proportion of female deaths). The alternative hypothesis is H₁: p₁ > p₂ (the proportion of male deaths is greater than the proportion of female deaths).
Calculate the sample proportions for male and female deaths. Let p₁ = x₁/n₁, where x₁ is the number of male deaths (242) and n₁ is the total number of deaths (242 + 64). Similarly, calculate p₂ = x₂/n₂, where x₂ is the number of female deaths (64) and n₂ is the total number of deaths.
Determine the pooled proportion (p̂) under the null hypothesis. The formula for the pooled proportion is: p̂ = (x₁ + x₂) / (n₁ + n₂), where x₁ and x₂ are the counts of male and female deaths, and n₁ and n₂ are the total sample sizes.
Compute the test statistic using the formula for a two-proportion z-test: z = (p₁ - p₂) / sqrt(p̂(1 - p̂)(1/n₁ + 1/n₂)). Substitute the values of p₁, p₂, p̂, n₁, and n₂ into the formula.
Compare the calculated z-value to the critical z-value for a one-tailed test at the 0.01 significance level. If the calculated z-value is greater than the critical z-value, reject the null hypothesis. Otherwise, fail to reject the null hypothesis. Interpret the result in the context of the problem.

Risposta video verificata per un problema simile:

Questa soluzione video è stata consigliata dai nostri tutor come utile per risolvere questo problema.
Durata del video:
4m

Concetti chiave

Ecco i concetti essenziali che devi comprendere per rispondere correttamente alla domanda.

Hypothesis Testing

Hypothesis testing is a statistical method used to make decisions about a population based on sample data. It involves formulating a null hypothesis (H0) and an alternative hypothesis (H1). In this case, the null hypothesis would state that the proportion of male deaths is equal to or less than that of female deaths, while the alternative hypothesis would claim that the proportion of male deaths is greater.
Video consigliato:
Percorso guidato
06:21
Step 1: Write Hypotheses

Significance Level

The significance level, often denoted as alpha (α), is the threshold for determining whether to reject the null hypothesis. A significance level of 0.01 indicates that there is a 1% risk of concluding that a difference exists when there is none. This means that if the p-value obtained from the test is less than 0.01, we would reject the null hypothesis in favor of the alternative.
Video consigliato:
Percorso guidato
04:46
Step 4: State Conclusion Example 4

Proportion

A proportion is a statistical measure that represents the part of a whole. In this context, it refers to the ratio of male deaths to the total number of deaths from lightning strikes. Understanding proportions is crucial for comparing the likelihood of events occurring in different groups, such as male versus female deaths in this scenario.
Video consigliato:
Percorso guidato
09:27
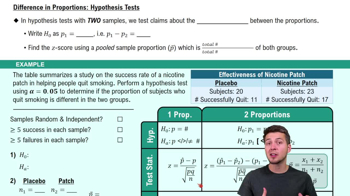
Difference in Proportions: Hypothesis Tests
Pratica correlata
Domanda del libro di testo

Hypothesis Test for Lightning Deaths Refer to the sample data given in Cumulative Review Exercise 1 and consider those data to be a random sample of annual lightning deaths from recent years. Use those data with a 0.01 significance level to test the claim that the mean number of annual lightning deaths is less than the mean of 72.6 deaths from the 1980s. If the mean is now lower than in the past, identify one of the several factors that could explain the decline.

95
views
Domanda del libro di testo

Robust Explain what is meant by the statements that the t test for a claim about μ is robust, but the (chi)^2 test for a claim about σ is not robust.

262
views
Domanda del libro di testo

Discarded Plastic Find the test statistic used for the hypothesis test described in Exercise 1.

95
views
Domanda del libro di testo

Job Search A Gallup poll of 195,600 employees showed that 51% of them were actively searching for new jobs. Use a 0.01 significance level to test the claim that the majority of employees are searching for new jobs

114
views
Domanda del libro di testo

Discarded Plastic


What distribution is used for the hypothesis test described in Exercise 1?

For the hypothesis test described in Exercise 1, is it necessary to determine whether the 62 weights appear to be from a population having a normal distribution? Why or why not?

111
views
Domanda del libro di testo

Type I Error and Type II Error


a. In general, what is a type I error? In general, what is a type II error?

365
views