

Ch. 8 - Hypothesis Testing
Triola - Elementary Statistics 14th Edition
Triola14th EditionElementary StatisticsISBN: 9780137366446Non è quello che usi tu?Cambia libro di testo
Capitolo 8, Problema 8.2.1c

Statistical Literacy and Critical Thinking
In Exercises 1–4, use the results from a Hankook Tire Gauge Index survey of a simple random sample of 1020 adults. Among the 1020 respondents, 86% rated themselves as above average drivers. We want to test the claim that more than 3/4 of adults rate themselves as above average drivers.


Number and Proportions


c. For the hypothesis test, identify the value used for the population proportion and use the symbol that represents it.

Guida verificata passo dopo passo
1
Identify the claim: The claim is that more than 3/4 (or 0.75) of adults rate themselves as above-average drivers. This is a one-tailed test since the claim specifies 'more than.'
Define the null hypothesis (H₀) and the alternative hypothesis (H₁): H₀: p ≤ 0.75 (the population proportion is less than or equal to 0.75), and H₁: p > 0.75 (the population proportion is greater than 0.75).
Determine the value used for the population proportion: The population proportion is represented by the symbol 'p.' For the null hypothesis, the value of p is 0.75, as this is the value being tested against.
Understand the sample proportion: The sample proportion (denoted as p̂) is calculated from the survey data. In this case, 86% of the 1020 respondents rated themselves as above-average drivers, so p̂ = 0.86.
Clarify the role of the population proportion: The population proportion (p = 0.75) is the hypothesized value under the null hypothesis, and it will be used in the hypothesis test to compare against the sample proportion (p̂ = 0.86).

Risposta video verificata per un problema simile:

Questa soluzione video è stata consigliata dai nostri tutor come utile per risolvere questo problema.
Durata del video:
1m

Concetti chiave

Ecco i concetti essenziali che devi comprendere per rispondere correttamente alla domanda.

Population Proportion

The population proportion, denoted as 'p', represents the fraction of a population that exhibits a certain characteristic. In this context, it refers to the proportion of adults who rate themselves as above average drivers. Understanding this concept is crucial for hypothesis testing, as it serves as the benchmark against which sample data is compared.
Video consigliato:
Percorso guidato
05:45
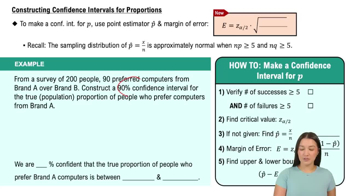
Constructing Confidence Intervals for Proportions

Hypothesis Testing

Hypothesis testing is a statistical method used to make inferences about a population based on sample data. It involves formulating a null hypothesis (H0) and an alternative hypothesis (H1). In this case, the null hypothesis would state that the population proportion of adults who consider themselves above average drivers is 0.75 or less, while the alternative hypothesis would claim it is greater than 0.75.
Video consigliato:
Percorso guidato
06:21
Step 1: Write Hypotheses

Simple Random Sample

A simple random sample is a subset of individuals chosen from a larger population, where each individual has an equal chance of being selected. This method helps ensure that the sample is representative of the population, which is essential for the validity of statistical inferences. In the given survey, the sample of 1020 adults was randomly selected to assess their self-perception as drivers.
Video consigliato:
Percorso guidato
05:11
Sampling Distribution of Sample Proportion
Pratica correlata
Domanda del libro di testo

Lightning Deaths Listed below are the numbers of deaths from lightning strikes in the United States each year for a sequence of recent and consecutive years. Find the values of the indicated statistics.

46 51 44 51 43 32 38 48 45 27 34 29 26 28 23 26 28 40 16 20

d. Variance

158
views
Domanda del libro di testo

RESAMPLING

c. When testing a claim about a proportion or mean or standard deviation, what is an important advantage of using a resampling method instead of the parametric method described in the preceding sections of this chapter?

193
views
Domanda del libro di testo

Using Confidence Intervals to Test Hypotheses When analyzing the last digits of telephone numbers in Port Jefferson, it is found that among 1000 randomly selected digits, 119 are zeros. If the digits are randomly selected, the proportion of zeros should be 0.1.


c. Use the sample data to construct a 95% confidence interval estimate of the proportion of zeros. What does the confidence interval suggest about the claim that the proportion of zeros equals 0.1?

100
views
Domanda del libro di testo

Using Confidence Intervals to Test Hypotheses When analyzing the last digits of telephone numbers in Port Jefferson, it is found that among 1000 randomly selected digits, 119 are zeros. If the digits are randomly selected, the proportion of zeros should be 0.1.


b. Use the P-value method with a 0.05 significance level to test the claim that the proportion of zeros equals 0.1.

133
views
Domanda del libro di testo

Lightning Deaths Listed below are the numbers of deaths from lightning strikes in the United States each year for a sequence of recent and consecutive years. Find the values of the indicated statistics.

46 51 44 51 43 32 38 48 45 27 34 29 26 28 23 26 28 40 16 20

c. standard deviation

118
views
Domanda del libro di testo

Lightning Deaths Based on the results given in Cumulative Review Exercise 6, assume that for a randomly selected lightning death, there is a 0.8 probability that the victim is a male.

a. Find the probability that three random people killed by lightning strikes are all males.

86
views