


Ch. 8 - Hypothesis Testing
Triola - Elementary Statistics 14th Edition
Triola14th EditionElementary StatisticsISBN: 9780137366446Non è quello che usi tu?Cambia libro di testo
Capitolo 8, Problema 11

Technology
In Exercises 9–12, test the given claim by using the display provided from technology. Use a 0.05 significance level. Identify the null and alternative hypotheses, test statistic, P-value (or range of P-values), or critical value(s), and state the final conclusion that addresses the original claim.


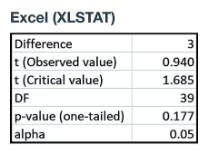
Tower of Terror Data Set 33 “Disney World Wait Times” includes wait times (minutes) for the Tower of Terror ride at 5:00 PM. Using the first 40 times to test the claim that the mean of all such wait times is more than 30 minutes, the accompanying Excel display is obtained.


tab3

Guida verificata passo dopo passo
1
Step 1: Identify the null hypothesis (H₀) and the alternative hypothesis (H₁). The null hypothesis is H₀: μ ≤ 30 (the mean wait time is 30 minutes or less), and the alternative hypothesis is H₁: μ > 30 (the mean wait time is more than 30 minutes). This is a one-tailed test.
Step 2: Determine the significance level (α). From the problem, α = 0.05.
Step 3: Locate the test statistic and critical value. From the Excel output, the test statistic (t observed) is 0.940, and the critical value (t critical) for a one-tailed test with 39 degrees of freedom is 1.685.
Step 4: Compare the test statistic to the critical value. If the test statistic is greater than the critical value, reject the null hypothesis. Otherwise, fail to reject the null hypothesis. Here, 0.940 < 1.685, so we fail to reject the null hypothesis.
Step 5: Interpret the p-value. The p-value is 0.177, which is greater than the significance level (0.05). This also supports the decision to fail to reject the null hypothesis. Conclude that there is not enough evidence to support the claim that the mean wait time is more than 30 minutes.

Risposta video verificata per un problema simile:

Questa soluzione video è stata consigliata dai nostri tutor come utile per risolvere questo problema.
Durata del video:
5m

Concetti chiave

Ecco i concetti essenziali che devi comprendere per rispondere correttamente alla domanda.

Null and Alternative Hypotheses

In hypothesis testing, the null hypothesis (H0) represents a statement of no effect or no difference, while the alternative hypothesis (H1) suggests that there is an effect or a difference. In this case, the null hypothesis would state that the mean wait time is 30 minutes or less, while the alternative hypothesis would claim that the mean wait time is greater than 30 minutes.
Video consigliato:
Percorso guidato
06:21
Step 1: Write Hypotheses

P-value

The P-value is a statistical measure that helps determine the significance of the results from a hypothesis test. It represents the probability of obtaining test results at least as extreme as the observed results, assuming that the null hypothesis is true. A smaller P-value indicates stronger evidence against the null hypothesis. In this scenario, a P-value of 0.177 suggests that there is not enough evidence to reject the null hypothesis at the 0.05 significance level.
Video consigliato:
Percorso guidato
06:50
Step 3: Get P-Value

Significance Level (Alpha)

The significance level, denoted as alpha (α), is the threshold used to determine whether to reject the null hypothesis. It represents the probability of making a Type I error, which occurs when the null hypothesis is incorrectly rejected. In this case, an alpha of 0.05 means that there is a 5% risk of concluding that the mean wait time is greater than 30 minutes when it is not, guiding the decision-making process in hypothesis testing.
Video consigliato:
Percorso guidato
04:46
Step 4: State Conclusion Example 4
Pratica correlata
Domanda del libro di testo

Testing Hypotheses

In Exercises 13–24, assume that a simple random sample has been selected and test the given claim. Unless specified by your instructor, use either the P-value method or the critical value method for testing hypotheses. Identify the null and alternative hypotheses, test statistic, P-value (or range of P-values), or critical value(s), and state the final conclusion that addresses the original claim.


Diastolic Blood Pressure Diastolic blood pressure levels of 60 mm Hg or lower are considered to be too low. For the 300 diastolic blood pressure levels listed in Data Set 1 “Body Data” from Appendix B, the mean is 70.75333 mm Hg and the standard deviation is 11.61618 mm Hg. Use a 0.01 significance level to test the claim that the sample is from a population with a mean greater than 60 mm Hg.

118
views
Domanda del libro di testo

Testing Hypotheses

In Exercises 13–24, assume that a simple random sample has been selected and test the given claim. Unless specified by your instructor, use either the P-value method or the critical value method for testing hypotheses. Identify the null and alternative hypotheses, test statistic, P-value (or range of P-values), or critical value(s), and state the final conclusion that addresses the original claim.


Systolic Blood Pressure Systolic blood pressure levels above 120 mm Hg are considered to be high. For the 300 systolic blood pressure levels listed in Data Set 1 “Body Data” from Appendix B, the mean is 122.96000 mm Hg and the standard deviation is 15.85169 mm Hg. Use a 0.01 significance level to test the claim that the sample is from a population with a mean greater than 120 mm Hg.

115
views
Domanda del libro di testo

Using Confidence Intervals to Test Hypotheses When analyzing the last digits of telephone numbers in Port Jefferson, it is found that among 1000 randomly selected digits, 119 are zeros. If the digits are randomly selected, the proportion of zeros should be 0.1.


d. Compare the results from the critical value method, the P-value method, and the confidence interval method. Do they all lead to the same conclusion?

148
views
Domanda del libro di testo

Technology

In Exercises 9–12, test the given claim by using the display provided from technology. Use a 0.05 significance level. Identify the null and alternative hypotheses, test statistic, P-value (or range of P-values), or critical value(s), and state the final conclusion that addresses the original claim.


Peanut Butter Cups Data Set 38 “Candies” includes weights of Reese’s peanut butter cups. The accompanying Statdisk display results from using all 38 weights to test the claim that the sample is from a population with a mean equal to 8.953 g.


138
views
Domanda del libro di testo

Lightning Deaths Listed below are the numbers of deaths from lightning strikes in the United States each year for a sequence of recent and consecutive years. Find the values of the indicated statistics.

46 51 44 51 43 32 38 48 45 27 34 29 26 28 23 26 28 40 16 20

e. Range

113
views
Domanda del libro di testo

Testing Hypotheses

In Exercises 13–24, assume that a simple random sample has been selected and test the given claim. Unless specified by your instructor, use either the P-value method or the critical value method for testing hypotheses. Identify the null and alternative hypotheses, test statistic, P-value (or range of P-values), or critical value(s), and state the final conclusion that addresses the original claim.


Taxi Fares For the first 40 taxi fares (dollars) listed in Data Set 32 “Taxis” from Appendix B, the mean is \$12.035 and the standard deviation is \$8.361. Use a 0.05 significance level to test the claim that the mean cost of a taxicab ride in New York City is less than \$15.00.

114
views