In Exercises 63–82, use a sketch to find the exact value of each expression. tan [cos⁻¹ (− 1/3)]
Ch. 2 - Graphs of the Trigonometric Functions; Inverse Trigonometric Functions

Tutti i libri di testo
Blitzer 3rd Edition
Ch. 2 - Graphs of the Trigonometric Functions; Inverse Trigonometric Functions
Problema 68
Blitzer 3rd Edition
Ch. 2 - Graphs of the Trigonometric Functions; Inverse Trigonometric Functions
Problema 68Capitolo 2, Problema 68
In Exercises 67–68, use the method of adding y-coordinates to graph each function for 0 ≤ x ≤ 4. y = cos πx + sin π/2 x
Guida verificata passo dopo passo1
Identify the given function: \(y = \cos(\pi x) + \sin\left(\frac{\pi}{2} x\right)\), which is a sum of two trigonometric functions.
Choose values of \(x\) in the interval \(0 \leq x \leq 4\). For example, select integer values \(x = 0, 1, 2, 3, 4\) to start plotting points.
Calculate the \(y\)-coordinate for each chosen \(x\) by evaluating each trigonometric term separately: compute \(\cos(\pi x)\) and \(\sin\left(\frac{\pi}{2} x\right)\), then add these two results to get \(y\).
Plot each point \((x, y)\) on the coordinate plane using the values found in the previous step.
Connect the plotted points smoothly to graph the function over the interval \(0 \leq x \leq 4\), noting the periodic behavior of the cosine and sine components.

Risposta video verificata per un problema simile:
Questa soluzione video è stata consigliata dai nostri tutor come utile per risolvere questo problema.
Durata del video:
4mConcetti chiave
Ecco i concetti essenziali che devi comprendere per rispondere correttamente alla domanda.
Graphing Trigonometric Functions
Graphing trigonometric functions involves plotting points based on their values at specific x-coordinates. For functions like y = cos(πx) and y = sin(π/2 x), understanding their periodicity and amplitude helps in accurately sketching their curves over the given interval.
Video consigliato:
Percorso guidato
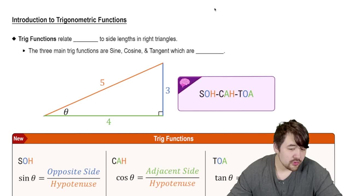
Introduction to Trigonometric Functions
Sum of Functions (Adding y-coordinates)
When combining functions by adding their y-values, the resulting graph at each x is the sum of the individual function values. This method requires calculating y-values of each function separately at given x-points and then adding them to find the new y-coordinate for the combined function.
Video consigliato:
Percorso guidato
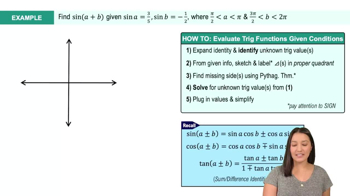
Example 7
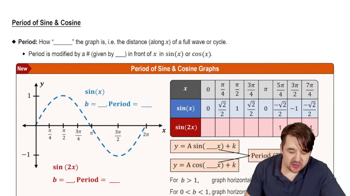
Trigonometric Function Periods and Frequencies
The period of a trigonometric function is the length of one complete cycle. For y = cos(πx), the period is 2, and for y = sin(π/2 x), the period is 4. Knowing these periods helps in determining key points and behavior of the functions within the interval 0 ≤ x ≤ 4.
Video consigliato:
Percorso guidato
Period of Sine and Cosine Functions
Pratica correlata
Domanda del libro di testo
853
views
Domanda del libro di testo
In Exercises 63–82, use a sketch to find the exact value of each expression. _ sin (cos⁻¹ √2/2)
975
views
Domanda del libro di testo
In Exercises 75–78, graph one period of each function. y = |2 cos x/2|
558
views
Domanda del libro di testo
In Exercises 63–82, use a sketch to find the exact value of each expression. tan [sin⁻¹ (− 3/5)]
697
views
Domanda del libro di testo
In Exercises 67–68, an object is attached to a coiled spring. In Exercise 67, the object is pulled down (negative direction from the rest position) and then released. In Exercise 68, the object is propelled downward from its rest position. Write an equation for the distance of the object from its rest position after t seconds.
747
views
Domanda del libro di testo
In Exercises 61–66, use the method of adding y-coordinates to graph each function for 0 ≤ x ≤ 2π. y = cos x + sin 2x
687
views