Ch. 4 - Graphs of the Circular Functions
Lial - Trigonometry 12th Edition
Lial12th EditionTrigonometryISBN: 9780136552161, 9780135440780, 9780136881117, 9780135440827, 9780135924891Non è quello che usi tu?Cambia libro di testo
Capitolo 5, Problema 4

Fill in the blank(s) to correctly complete each sentence.
The graph of y = -3 sin x is obtained by stretching the graph of y = sin x by a factor of ________ and reflecting across the ________-axis.

Guida verificata passo dopo passo
1
Identify the general form of the sine function transformation: \(y = A \sin x\), where \(A\) represents the amplitude, which affects the vertical stretch or compression of the graph.
Compare the given function \(y = -3 \sin x\) with the basic sine function \(y = \sin x\). Notice that the amplitude changes from 1 to 3, indicating a vertical stretch by a factor of 3.
Observe the negative sign in front of the amplitude, which means the graph is reflected across the x-axis.
Summarize the transformation: the graph is stretched vertically by a factor of 3 and reflected across the x-axis.
Fill in the blanks accordingly: The graph of \(y = -3 \sin x\) is obtained by stretching the graph of \(y = \sin x\) by a factor of 3 and reflecting across the x-axis.

Risposta video verificata per un problema simile:

Questa soluzione video è stata consigliata dai nostri tutor come utile per risolvere questo problema.

Concetti chiave

Ecco i concetti essenziali che devi comprendere per rispondere correttamente alla domanda.

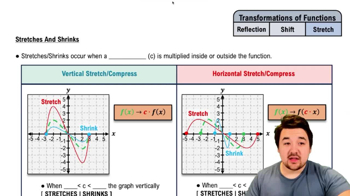
Amplitude and Vertical Stretching

The amplitude of a sine function is the absolute value of the coefficient before sin x, which determines the vertical stretch or compression. For y = -3 sin x, the amplitude is 3, meaning the graph is stretched vertically by a factor of 3 compared to y = sin x.
Video consigliato:
Percorso guidato
6:02
Stretches and Shrinks of Functions

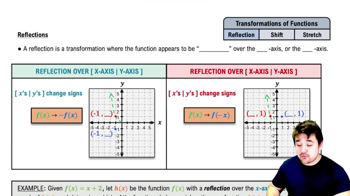
Reflection Across the x-axis

A negative coefficient before the sine function indicates a reflection of the graph across the x-axis. This flips the graph upside down, changing the direction of the peaks and troughs while preserving the shape.
Video consigliato:
Percorso guidato
5:00
Reflections of Functions

Basic Sine Function Graph

The graph of y = sin x is a periodic wave oscillating between -1 and 1 with a period of 2π. Understanding this baseline graph is essential to recognize how transformations like stretching and reflection affect its shape.
Video consigliato:
Percorso guidato
5:53
Graph of Sine and Cosine Function