Ch. 4 - Graphs of the Circular Functions
Lial - Trigonometry 12th Edition
Lial12th EditionTrigonometryISBN: 9780136552161, 9780135440780, 9780136881117, 9780135440827, 9780135924891Non è quello che usi tu?Cambia libro di testo
Capitolo 5, Problema 39

Graph each function over a two-period interval.
y = cos (x - π/2 )

Guida verificata passo dopo passo
1
Identify the base function and its characteristics. Here, the base function is \(y = \cos x\), which has a period of \(2\pi\) and an amplitude of 1.
Understand the transformation inside the cosine function. The function is \(y = \cos(x - \frac{\pi}{2})\), which represents a horizontal shift (phase shift) of \(\frac{\pi}{2}\) units to the right.
Determine the interval for graphing. Since one period of \(\cos x\) is \(2\pi\), a two-period interval will be \(4\pi\). Choose an interval such as \([0, 4\pi]\) or \([-\pi, 3\pi]\) to cover two full periods.
Plot key points by evaluating the function at important values within the interval, such as at multiples of \(\frac{\pi}{2}\), considering the phase shift. For example, calculate \(y\) at \(x = \frac{\pi}{2}, \pi, \frac{3\pi}{2}, 2\pi\), etc., by substituting into \(y = \cos(x - \frac{\pi}{2})\).
Sketch the graph using the plotted points, showing the wave pattern shifted to the right by \(\frac{\pi}{2}\), maintaining the amplitude and period of the original cosine function over the two-period interval.

Risposta video verificata per un problema simile:

Questa soluzione video è stata consigliata dai nostri tutor come utile per risolvere questo problema.

Concetti chiave

Ecco i concetti essenziali che devi comprendere per rispondere correttamente alla domanda.

Graphing Trigonometric Functions

Graphing trigonometric functions involves plotting their values over a specified interval to visualize their periodic behavior. For cosine functions, the graph oscillates between -1 and 1, repeating every 2π units. Understanding the shape and key points of the cosine curve is essential for accurate graphing.
Video consigliato:
Percorso guidato
6:04
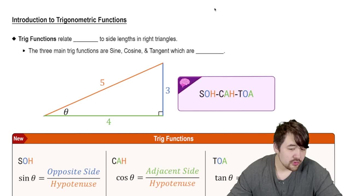
Introduction to Trigonometric Functions

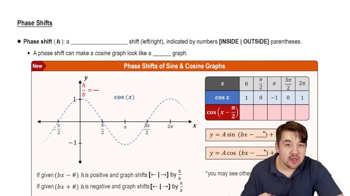
Phase Shift in Trigonometric Functions

A phase shift occurs when the input variable x is adjusted inside the function, such as in y = cos(x - π/2). This shifts the graph horizontally by the specified amount—in this case, π/2 units to the right—without changing the shape or period of the function.
Video consigliato:

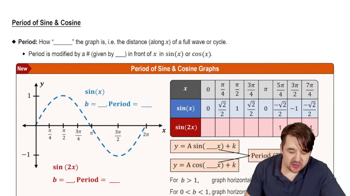
Period of the Cosine Function

The period of the cosine function is the length of one complete cycle, which is 2π. When graphing over a two-period interval, you plot the function from 0 to 4π (or any interval of length 4π) to capture two full oscillations of the cosine wave.
Video consigliato:
Percorso guidato
5:33
Period of Sine and Cosine Functions