Ch. R - Algebra Review
Lial - Trigonometry 12th Edition
Lial12th EditionTrigonometryISBN: 9780136552161, 9780135440780, 9780136881117, 9780135440827, 9780135924891Non è quello che usi tu?Cambia libro di testo
Capitolo 1, Problema 69

Graph each function. See Examples 6–8. h(x) = 2x² - 1

Guida verificata passo dopo passo
1
Recognize that the given function \(h(x) = 2x^2 - 1\) is a quadratic function, which graphs as a parabola.
Identify the key features of the parabola: the coefficient of \(x^2\) is positive (2), so the parabola opens upwards.
Find the vertex of the parabola. Since the function is in the form $h(x) = ax^2 + bx + c$ with \(a=2\), \(b=0\), and \(c=-1\), the vertex's x-coordinate is given by \(x = -\frac{b}{2a} = 0\).
Calculate the y-coordinate of the vertex by substituting \(x=0\) into the function: \(h(0) = 2(0)^2 - 1 = -1\). So, the vertex is at \((0, -1)\).
Plot the vertex and additional points by choosing values of \(x\) (for example, \(x=1\) and \(x=-1\)), calculate \(h(x)\) for these values, and then sketch the parabola opening upwards through these points.

Risposta video verificata per un problema simile:

Questa soluzione video è stata consigliata dai nostri tutor come utile per risolvere questo problema.
Durata del video:
5m

Concetti chiave

Ecco i concetti essenziali che devi comprendere per rispondere correttamente alla domanda.

Understanding Quadratic Functions

A quadratic function is a polynomial of degree two, generally expressed as f(x) = ax² + bx + c. Its graph is a parabola, which opens upward if a > 0 and downward if a < 0. Recognizing the shape and key features of quadratics is essential for graphing.
Video consigliato:
Percorso guidato
6:36
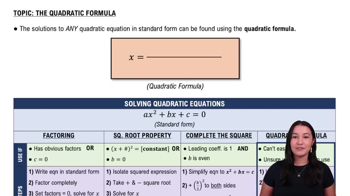
Quadratic Formula

Vertex and Axis of Symmetry

The vertex of a parabola is its highest or lowest point, found using the formula x = -b/(2a). The axis of symmetry is a vertical line through the vertex that divides the parabola into two mirror images. Identifying these helps in accurately sketching the graph.
Video consigliato:

Plotting Points and Intercepts

To graph a quadratic function, calculate and plot key points such as the vertex, y-intercept (where x=0), and x-intercepts (roots). These points guide the shape and position of the parabola on the coordinate plane.
Video consigliato:
Percorso guidato
4:08
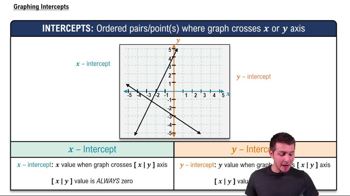
Graphing Intercepts