Skip to main content
Statistics for Business
나의 코스
배우기
시험 준비
AI 튜터
학습 가이드
플래시카드
탐험해 보세요
앱을 사용해 보세요
나의 코스
배우기
시험 준비
AI 튜터
학습 가이드
플래시카드
탐험해 보세요
앱을 사용해 보세요
뒤로
Statistics for Business - Exam 4 Study Guide
카드를 뒤집기 위해 탭할 수 있습니다.
Properties of the normal curve
카드를 뒤집기 위해 탭할 수 있습니다.
👆
Properties of the normal curve
The high point is at the mean.
The curve is symmetric.
Area under the curve to the right of the mean is 0.5.
진행 상황 추적
컨트롤 버튼이 '내비게이션' 모드로 변경되었습니다.
1/20
추천 영상
VideoThumbView.guidedCourse
03:50
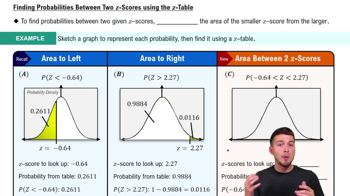
Probabilities Between Two Values
560
views
21
rank
VideoThumbView.guidedCourse
09:47
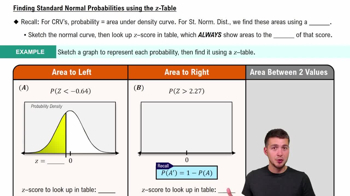
Finding Standard Normal Probabilities using z-Table
1074
views
25
rank
VideoThumbView.guidedCourse
08:50
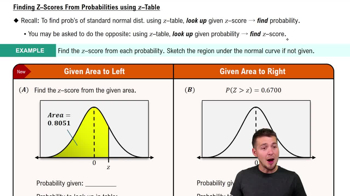
Z-Scores from Probabilities
590
views
10
rank
이 집합의 용어 (20)
하이드의 정의
Properties of the normal curve
The high point is at the mean.
The curve is symmetric.
Area under the curve to the right of the mean is 0.5.
Standard normal distribution mean and standard deviation
Mean is 0 and standard deviation is 1.
Probability that Z is less than a value in standard normal
Use the standard normal table or calculator to find P(Z < z).
Probability that Z is greater than a value in standard normal
Calculate 1 - P(Z < z) using the standard normal table.
Probability that Z is between two values in standard normal
Calculate P(Z < upper) - P(Z < lower).
Normal distribution probability for X > a
Convert X to Z using \(Z=\frac{X-\mu}{\sigma}\), then find P(Z > z).
Finding X-value for a given cumulative probability in normal distribution
Use the inverse normal function with mean and standard deviation to find X for given percentile.
Symmetric interval around mean containing a given percentage
Find Z-scores for the tails, then convert to X-values using \(X=\mu + Z\sigma\).
Uniform distribution mean
Mean is \(\frac{a+b}{2}\) where a and b are the interval endpoints.
Uniform distribution standard deviation
Standard deviation is \(\frac{b-a}{\sqrt{12}}\).
Probability for uniform distribution between two values
Probability is the length of the interval divided by total length: \(\frac{b-a}{B-A}\).
Exponential distribution parameter and meaning
λ
is the rate parameter; mean waiting time is \(\frac{1}{\lambda}\).
Exponential distribution probability less than X
P(X < x) = 1 - \(e^{-\lambda x}\).
Exponential distribution probability greater than X
P(X > x) = \(e^{-\lambda x}\).
Sampling distribution of the mean for normal population
If population is normal, the sample mean distribution is also normal with mean \(\mu\) and standard deviation \(\frac{\sigma}{\sqrt{n}}\).
Sample proportion formula
Sample proportion \(p=\frac{x}{n}\), where x is number of successes and n is sample size.
Standard error of sample proportion
Standard error = \(\sqrt{\frac{p(1-p)}{n}}\) where p is population proportion.
Probability that sample proportion lies within an interval
Use normal approximation with mean p and standard error to find probabilities.
Interpreting probability intervals for sample percentages
Symmetrical limits around population proportion contain the sample percentage with given probability.
Calculating probability for sample mean less than a value
Convert sample mean to Z using \(Z=\frac{\bar{X}-\mu}{\sigma/\sqrt{n}}\) and find P(Z < z).
 뒤로
 03:50

 뒤로