 뒤로
Statistics for Business: Key Concepts and Methods
 05:53

이 집합의 용어 (20)
Descriptive statistics summarize and describe the main features of a data set, including measures like mean, median, mode, variance, and standard deviation.
Probability quantifies the likelihood of an event occurring, ranging from 0 (impossible) to 1 (certain), and is fundamental for risk assessment and decision-making.
A random variable is a numerical outcome of a random phenomenon, which can be discrete or continuous, used to model uncertainty in business data.
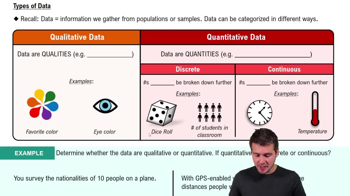
Discrete random variables take countable values, while continuous random variables take any value within an interval.
The CLT states that the sampling distribution of the sample mean approaches a normal distribution as sample size increases, regardless of the population distribution.
A confidence interval estimates a population parameter with a range of values and a specified confidence level, such as 95%.
Hypothesis testing is a method to decide whether there is enough evidence to reject a null hypothesis about a population parameter.
Type I error is rejecting a true null hypothesis; Type II error is failing to reject a false null hypothesis.
Regression analysis models the relationship between a dependent variable and one or more independent variables to predict outcomes and understand influences.
The least squares method estimates regression coefficients by minimizing the sum of squared differences between observed and predicted values.
R-squared measures the proportion of variance in the dependent variable explained by the independent variables in the regression model.
Simple regression uses one independent variable; multiple regression uses two or more independent variables to predict the dependent variable.
Key assumptions include linearity, independence, homoscedasticity (constant variance), normality of errors, and no multicollinearity among predictors.
The p-value is the probability of observing data as extreme as the sample, assuming the null hypothesis is true; a small p-value suggests rejecting the null.
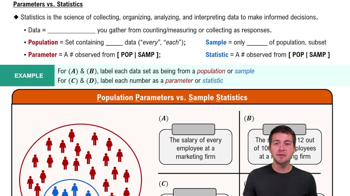
The population is the entire group of interest; a sample is a subset used to make inferences about the population.
A sampling distribution is the probability distribution of a statistic over many samples drawn from the same population.
Variance measures the average squared deviation from the mean, indicating data spread or variability.
Correlation measures association between variables; causation implies one variable directly affects another.
An outlier is an observation far from others; it can affect analysis results and may indicate data errors or special cases.
Statistical inference uses sample data to make generalizations or predictions about a population.