Histograms
- 작성 시간을 절약하려면 워크시트를 다운로드하세요
- 연습 문제를 풀기 시작해
- 막히면 영상 해답을 보세요
- 더 많은 인사이트를 원하시면 요약을 참고하세요

Histograms
4 문제점
문제 1객관식
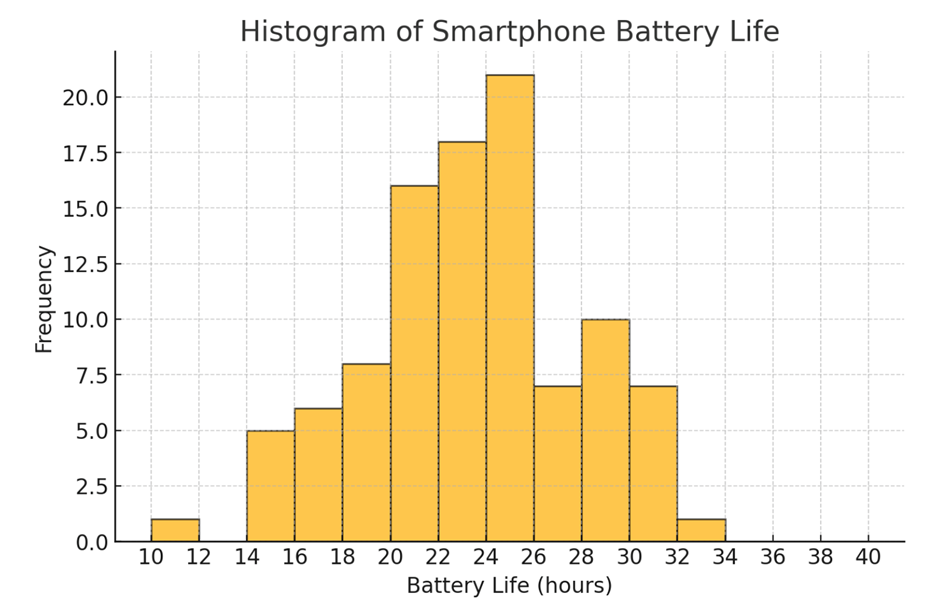
Use the following histogram generated by statistical software, which represents the battery life (in hours) of a sample of smartphones. (The values on the horizontal scale are rounded.)
What is the approximate number of smartphones represented in the three bars farthest to the right?
문제 2객관식
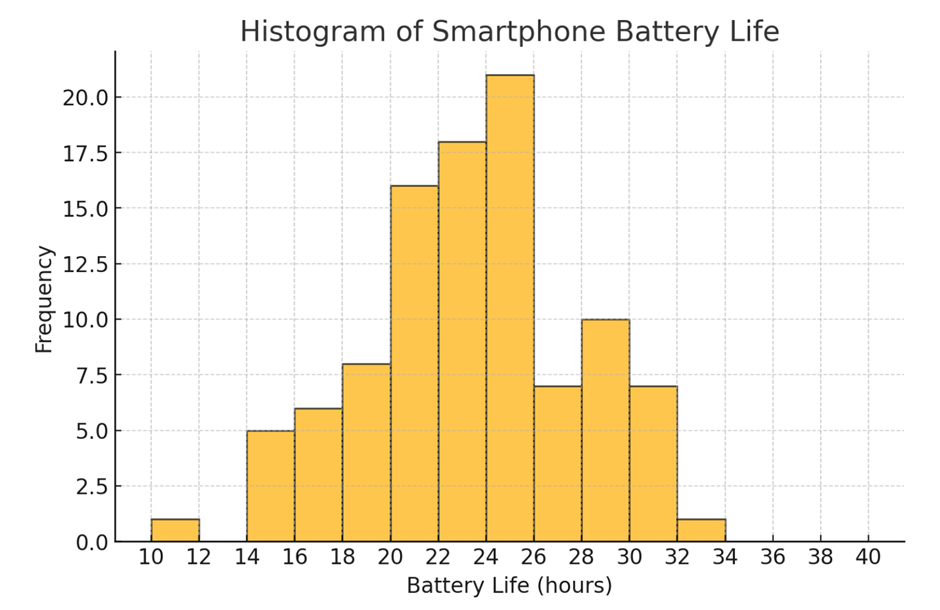
Use the following histogram generated by statistical software, which represents the battery life (in hours) of a sample of smartphones. Provide the estimated class width, along with the lower- and upper-class limits of the fourth bar from the left in the histogram.