Ch. 3 - Derivatives
Briggs - Calculus: Early Transcendentals 3rd Edition
Briggs3rd EditionCalculus: Early TranscendentalsISBN: 9780136847243당신이 사용하는 게 아니라요?교과서 변경
3장, 문제 82

{Use of Tech} Cell population The population of a culture of cells after t days is approximated by the function P(t)=1600 / 1 + 7e^−0.02t, for t≥0.
a. Graph the population function.  

검증된 단계별 안내
1
Step 1: Understand the function P(t) = \(\frac{1600}{1 + 7e^{-0.02t}\)}. This is a logistic function, which is commonly used to model population growth where the growth rate decreases as the population reaches a carrying capacity.
Step 2: Identify key features of the logistic function. The carrying capacity, or the maximum population, is 1600. The initial population can be found by evaluating P(0).
Step 3: Determine the horizontal asymptotes. As t approaches infinity, the term 7e^{-0.02t} approaches zero, so the function approaches the carrying capacity of 1600. As t approaches negative infinity, the function approaches zero.
Step 4: Calculate a few key points to help sketch the graph. Evaluate P(t) at t = 0, t = 10, t = 20, etc., to see how the population changes over time.
Step 5: Use a graphing tool or software to plot the function P(t) = \(\frac{1600}{1 + 7e^{-0.02t}\)}. Observe the S-shaped curve typical of logistic growth, starting near zero, increasing rapidly, and then leveling off near the carrying capacity.

비슷한 문제에 대한 검증된 영상 답변:

이 영상 해법은 위 문제에 도움이 된다고 튜터들이 추천한 것입니다.
영상 길이:
5m

주요 개념

질문에 올바르게 답하기 위해 반드시 이해해야 하는 핵심 개념들은 다음과 같습니다.

Logistic Growth Model

The function P(t) = 1600 / (1 + 7e^(-0.02t)) represents a logistic growth model, which describes how populations grow in a limited environment. Initially, the population grows exponentially, but as resources become limited, the growth rate slows and approaches a maximum carrying capacity, in this case, 1600 cells.
추천 영상:
04:39
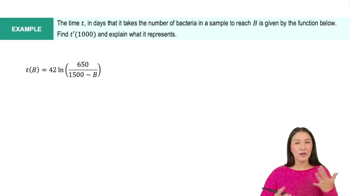
Derivative of the Natural Logarithmic Function Example 7

Exponential Function

The term e^(-0.02t) in the population function indicates an exponential decay factor, which influences how quickly the population approaches its carrying capacity. Exponential functions are characterized by their rapid growth or decay, and in this context, they help model the initial growth phase of the cell population before it stabilizes.
추천 영상:
6:13
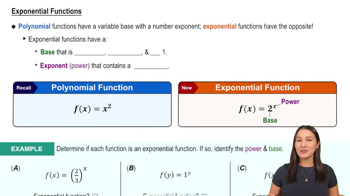
Exponential Functions

Graphing Functions

Graphing the population function involves plotting the values of P(t) against t to visualize how the cell population changes over time. Understanding how to graph functions is essential in calculus, as it allows for the analysis of behavior, trends, and key features such as intercepts, asymptotes, and limits.
추천 영상:
가이드 코스
5:53
Graph of Sine and Cosine Function