

Ch. 2 - Limits and Continuity
Hass - Thomas' Calculus 15th Edition
Hass15th EditionThomas' CalculusISBN: 9780137616077당신이 사용하는 게 아니라요?교과서 변경
2장, 문제 26c

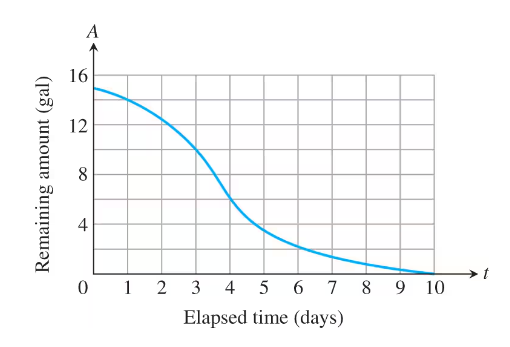
The accompanying graph shows the total amount of gasoline A in the gas tank of an automobile after it has been driven for t days.
img
c. Estimate the maximum rate of gasoline consumption and the specific time at which it occurs.

검증된 단계별 안내
1
To estimate the maximum rate of gasoline consumption, we need to find the point on the graph where the slope is steepest. This represents the greatest change in gasoline amount over time.
Identify the section of the graph where the gasoline amount decreases most rapidly. This is typically where the graph is steepest and the slope is most negative.
Calculate the slope of the tangent line at this point. The slope of the tangent line represents the rate of change of gasoline consumption at that specific time.
Use the derivative concept to find the slope of the tangent line. If the graph is a curve, the derivative at a point gives the slope of the tangent line at that point.
Estimate the time at which this maximum rate occurs by identifying the x-coordinate (time in days) corresponding to the steepest slope on the graph.

비슷한 문제에 대한 검증된 영상 답변:

이 영상 해법은 위 문제에 도움이 된다고 튜터들이 추천한 것입니다.
영상 길이:
2m

주요 개념

질문에 올바르게 답하기 위해 반드시 이해해야 하는 핵심 개념들은 다음과 같습니다.

Rate of Change

The rate of change in calculus refers to how a quantity changes in relation to another variable. In this context, it represents the rate at which gasoline is consumed over time, which can be determined by analyzing the slope of the graph at various points. A steeper slope indicates a higher rate of consumption.
추천 영상:
가이드 코스
04:16
Intro To Related Rates

Critical Points

Critical points are values of the independent variable where the derivative of a function is zero or undefined. These points are essential for identifying local maxima and minima. In the context of the gasoline consumption graph, finding critical points will help determine when the maximum rate of consumption occurs.
추천 영상:
04:50
Critical Points

Graphical Interpretation

Graphical interpretation involves analyzing the visual representation of data to extract meaningful information. For this question, understanding how to read the graph of gasoline levels over time is crucial. By observing the shape and trends in the graph, one can estimate the maximum rate of consumption and identify the specific time it occurs.
추천 영상:
05:02
Determining Differentiability Graphically
관련 실천
교과서 질문

[Technology Exercise] Let f(t) = 1/t for t≠0.


a. Find the average rate of change of f with respect to t over the intervals (i) from t=2 to t=3, and (ii) from t=2 to t=T.


b. Make a table of values of the average rate of change of f with respect to t over the interval [2,T], for some values of T approaching 2, say T = 2.1, 2.01, 2.001, 2.0001, 2.00001, and 2.000001.


c. What does your table indicate is the rate of change of f with respect to t at t=2?

298
views
교과서 질문

The accompanying graph shows the total distance s traveled by a bicyclist after t hours.

b. Estimate the bicyclist’s instantaneous speed at the times t=1/2, t=2, and t=3.

400
views
교과서 질문

[Technology Exercise] Roots


Let ƒ(𝓍) = 𝓍³ ―𝓍― 1.


b. Solve the equation ƒ(𝓍) = 0 graphically with an error of magnitude at most 10⁻⁸ .

175
views
교과서 질문

Finding Limits

In Exercises 9–24, find the limit or explain why it does not exist.


lim x →π cos² (x― tan x)

210
views
교과서 질문

Finding Deltas Algebraically


Each of Exercises 15–30 gives a function f(x) and numbers L, c, and ε>0. In each case, find the largest open interval about c on which the inequality |f(x)−L| <ε holds. Then give a value for δ>0 such that for all x satisfying 0 < |x−c| < δ, the inequality |f(x)−L| < ε holds.


f(x) = mx, m > 0, L = 2m, c = 2, ε = 0.03

306
views
교과서 질문

[Technology Exercise] Roots


Let ƒ(𝓍) = 𝓍³ ―𝓍― 1.


c. It can be shown that the exact value of the solution in part (b) is


(1/2 + √69/18)¹/³ + (1/2 ― √69/18)¹/³


Evaluate this exact answer and compare it with the value you found in part (b).

168
views