Ch. 4 - Applications of Derivatives
4์žฅ, ๋ฌธ์ œ 4.30

Estimate the open intervals on which the function y = ฦ’(๐“) is


a. increasing.
b. decreasing.
c. Use the given graph of ฦ’' to indicate where any local extreme
values of the function occur, and whether each extreme
is a relative maximum or minimum.
<IMAGE>

๊ฒ€์ฆ๋œ ๋‹จ๊ณ„๋ณ„ ์•ˆ๋‚ด
1
Identify the intervals where the derivative ฦ’'(๐“) is positive. These intervals correspond to where the function y = ฦ’(๐“) is increasing.
Identify the intervals where the derivative ฦ’'(๐“) is negative. These intervals correspond to where the function y = ฦ’(๐“) is decreasing.
Locate the points where the derivative ฦ’'(๐“) changes sign from positive to negative. These points are potential locations for relative maxima of the function y = ฦ’(๐“).
Locate the points where the derivative ฦ’'(๐“) changes sign from negative to positive. These points are potential locations for relative minima of the function y = ฦ’(๐“).
Use the graph of ฦ’'(๐“) to confirm the exact locations of these sign changes and determine the nature of each local extremum (maximum or minimum) based on the sign change.

๋น„์Šทํ•œ ๋ฌธ์ œ์— ๋Œ€ํ•œ ๊ฒ€์ฆ๋œ ์˜์ƒ ๋‹ต๋ณ€:

์ด ์˜์ƒ ํ•ด๋ฒ•์€ ์œ„ ๋ฌธ์ œ์— ๋„์›€์ด ๋œ๋‹ค๊ณ  ํŠœํ„ฐ๋“ค์ด ์ถ”์ฒœํ•œ ๊ฒƒ์ž…๋‹ˆ๋‹ค.
์˜์ƒ ๊ธธ์ด:
4m

์ฃผ์š” ๊ฐœ๋…

์งˆ๋ฌธ์— ์˜ฌ๋ฐ”๋ฅด๊ฒŒ ๋‹ตํ•˜๊ธฐ ์œ„ํ•ด ๋ฐ˜๋“œ์‹œ ์ดํ•ดํ•ด์•ผ ํ•˜๋Š” ํ•ต์‹ฌ ๊ฐœ๋…๋“ค์€ ๋‹ค์Œ๊ณผ ๊ฐ™์Šต๋‹ˆ๋‹ค.

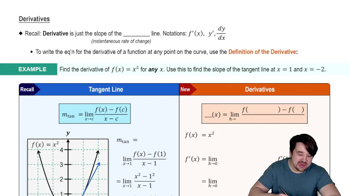
Derivative and its Sign

The derivative of a function, denoted as ฦ’'(๐“), provides information about the rate of change of the function. If ฦ’'(๐“) is positive over an interval, the function is increasing on that interval. Conversely, if ฦ’'(๐“) is negative, the function is decreasing. Understanding the sign of the derivative is crucial for determining where the function is increasing or decreasing.
์ถ”์ฒœ ์˜์ƒ:

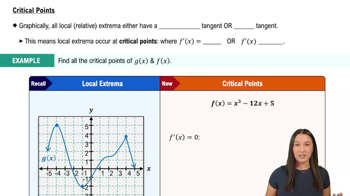
Critical Points

Critical points occur where the derivative ฦ’'(๐“) is zero or undefined. These points are potential locations for local extreme values, such as relative maxima or minima. Analyzing the behavior of the derivative around these points helps identify whether they correspond to peaks (maxima) or troughs (minima) in the function.
์ถ”์ฒœ ์˜์ƒ:
04:50
Critical Points

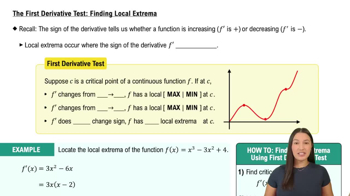
First Derivative Test

The First Derivative Test is used to classify critical points as relative maxima or minima. By examining the sign change of ฦ’'(๐“) around a critical point, one can determine the nature of the extremum. If ฦ’'(๐“) changes from positive to negative, the point is a relative maximum; if it changes from negative to positive, it is a relative minimum.
์ถ”์ฒœ ์˜์ƒ:
07:09
The First Derivative Test: Finding Local Extrema
๊ด€๋ จ ์‹ค์ฒœ
๊ต๊ณผ์„œ ์งˆ๋ฌธ

Roots (Zeros)


Show that the functions in Exercises 19โ€“26 have exactly one zero in the given interval.


r(ฮธ) = 2ฮธ โˆ’ cosยฒฮธ + โˆš2, (โˆ’โˆž, โˆž)

178
views
๊ต๊ณผ์„œ ์งˆ๋ฌธ

Finding Extrema from Graphs


In Exercises 15โ€“20, sketch the graph of each function and determine whether the function has any absolute extreme values on its domain. Explain how your answer is consistent with Theorem 1.


g(x) = {โˆ’x, 0 โ‰ค x < 1

x โˆ’ 1, 1 โ‰ค x โ‰ค 2

245
views
๊ต๊ณผ์„œ ์งˆ๋ฌธ

101. In Exercises 101 and 102, the graph of f' is given. Determine x-values corresponding to local minima, local maxima, and inflection points for the graph of f.

306
views
๊ต๊ณผ์„œ ์งˆ๋ฌธ

Use the linear approximation (1 + x)แต โ‰ˆ 1 + kx to find an approximation for the function f(x) for values of x near zero.


c. f(x) = 1/โˆš(1 + x)

228
views
๊ต๊ณผ์„œ ์งˆ๋ฌธ

109. Suppose the derivative of the function y = f(x) is

y'=(x-1)^2(x-2).

At what points, if any, does the graph of f have a local minimum, local maximum, or

point of inflection? (Hint: Draw the sign pattern for y'.)

170
views
๊ต๊ณผ์„œ ์งˆ๋ฌธ

In Exercises 53 and 54, find both dy/dx (treating y as a differentiable function of x) and dx/dy (treating x as a differentiable function of y). How do dy/dx and dx/dy seem to be related?


53. xyยณ + xยฒy = 6

237
views