Solve each equation. Then state whether the equation is an identity, a conditional equation, or an inconsistent equation. (3x+1)/3 - 13/2 = (1-x)/4
Ch. 1 - Equations and Inequalities

2장, 문제 27a
Graph each equation in Exercises 13 - 28. Let x = - 3, - 2, - 1, 0, 1, 2, 3
y = x3
검증된 단계별 안내1
Identify the given equation: y = x^3. This is a cubic function, which means the graph will have a characteristic S-shape, passing through the origin (0, 0).
Create a table of values for the given x-values: x = -3, -2, -1, 0, 1, 2, 3. For each x-value, substitute it into the equation y = x^3 to calculate the corresponding y-value. For example, when x = -3, y = (-3)^3 = -27.
Complete the table of values by calculating y for all the given x-values. The table will look like this: x = -3, -2, -1, 0, 1, 2, 3 and corresponding y-values will be calculated as y = x^3.
Plot the points from the table of values on a coordinate plane. For example, plot (-3, -27), (-2, -8), (-1, -1), (0, 0), (1, 1), (2, 8), and (3, 27).
Draw a smooth curve through the plotted points to represent the graph of the cubic function y = x^3. Ensure the curve reflects the S-shape characteristic of cubic functions, with the graph decreasing for negative x-values, passing through the origin, and increasing for positive x-values.

비슷한 문제에 대한 검증된 영상 답변:
이 영상 해법은 위 문제에 도움이 된다고 튜터들이 추천한 것입니다.
영상 길이:
2m주요 개념
질문에 올바르게 답하기 위해 반드시 이해해야 하는 핵심 개념들은 다음과 같습니다.
Graphing Functions
Graphing functions involves plotting points on a coordinate plane to visualize the relationship between the input (x-values) and output (y-values). For the equation y = x^3, each x-value corresponds to a specific y-value calculated by cubing x. Understanding how to plot these points accurately is essential for interpreting the function's behavior.
추천 영상:
가이드 코스
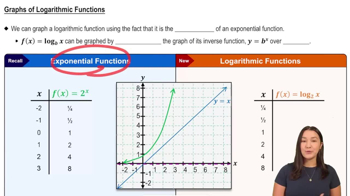
Graphs of Logarithmic Functions
Cubic Functions
Cubic functions are polynomial functions of degree three, characterized by their general form y = ax^3 + bx^2 + cx + d. The function y = x^3 is a simple cubic function where a = 1, b = 0, c = 0, and d = 0. These functions typically exhibit an S-shaped curve and can have one or two turning points, influencing their graph's shape and direction.
추천 영상:
가이드 코스
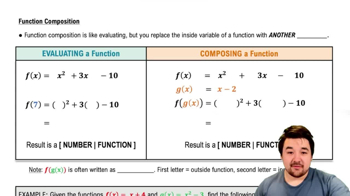
Function Composition
Evaluating Functions
Evaluating functions involves substituting specific values for the variable to find corresponding outputs. In this case, substituting x = -3, -2, -1, 0, 1, 2, and 3 into the equation y = x^3 allows us to calculate the y-values. This process is crucial for generating the points needed to accurately graph the function.
추천 영상:
가이드 코스
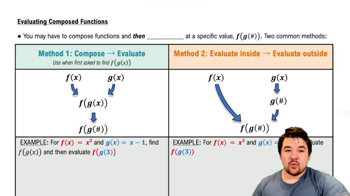
Evaluating Composed Functions
관련 실천
교과서 질문
1008
views
교과서 질문
Graph each equation in Exercises 13 - 28. Let x = - 3, - 2, - 1, 0, 1, 2, 3
y = x3 - 1
975
views
교과서 질문
The length of a rectangular pool is 6 meters less than twice the width. If the pool's perimeter is 126 meters, what are its dimensions?
766
views
교과서 질문
In all exercises, other than exercises with no solution, use interval notation to express solution sets and graph each solution set on a number line. In Exercises 27–50, solve each linear inequality. 3x - 7 ≥ 13
910
views
교과서 질문
In all exercises, other than exercises with no solution, use interval notation to express solution sets and graph each solution set on a number line. In Exercises 27–50, solve each linear inequality. 5x + 11 < 26
757
views
교과서 질문
Solve each radical equation in Exercises 11–30. Check all proposed solutions. √(2x + 3) + √(x - 2) = 2
787
views