Use the Leading Coefficient Test to determine the end behavior of the graph of the polynomial function.
Ch. 3 - Polynomial and Rational Functions

4장, 문제 19
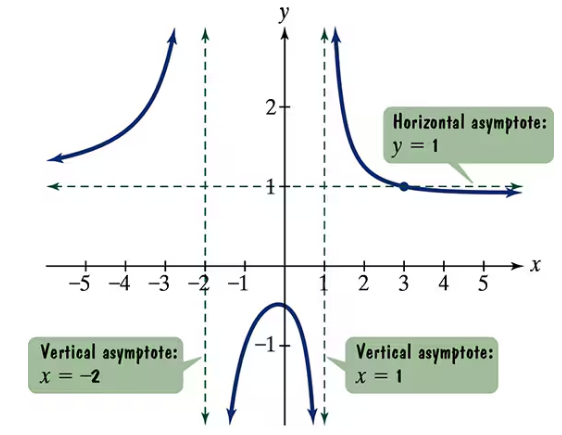
Use the graph of the rational function in the figure shown to complete each statement in Exercises 15–20.

As _____
검증된 단계별 안내1
Identify the horizontal asymptote from the graph. The horizontal asymptote is the line that the function approaches as x approaches infinity or negative infinity.
From the graph, observe the horizontal dashed line labeled as the horizontal asymptote, which is at y = 17.
Recall that for rational functions, the horizontal asymptote represents the value that f(x) approaches as x approaches infinity (x → ∞) or negative infinity (x → -∞).
Therefore, as x → ∞, the function f(x) approaches the horizontal asymptote y = 17.
Write the conclusion: As x → ∞, f(x) → 17.

비슷한 문제에 대한 검증된 영상 답변:
이 영상 해법은 위 문제에 도움이 된다고 튜터들이 추천한 것입니다.
영상 길이:
1m주요 개념
질문에 올바르게 답하기 위해 반드시 이해해야 하는 핵심 개념들은 다음과 같습니다.
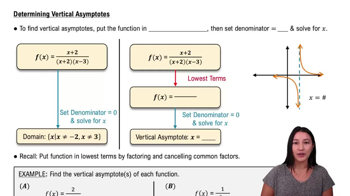
Vertical Asymptotes
Vertical asymptotes occur where a rational function's denominator is zero and the function approaches infinity or negative infinity. They represent values of x where the function is undefined and the graph shows a vertical line that the curve approaches but never crosses.
추천 영상:
가이드 코스
Determining Vertical Asymptotes
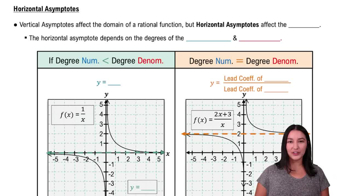
Horizontal Asymptotes
Horizontal asymptotes describe the behavior of a function as x approaches infinity or negative infinity. For rational functions, the horizontal asymptote is a horizontal line y = c that the graph approaches, indicating the end behavior of the function.
추천 영상:
가이드 코스
Determining Horizontal Asymptotes
End Behavior of Rational Functions
The end behavior of a rational function is determined by the degrees of the numerator and denominator polynomials. It shows how the function behaves as x approaches positive or negative infinity, often approaching a horizontal asymptote or increasing/decreasing without bound.
추천 영상:
가이드 코스
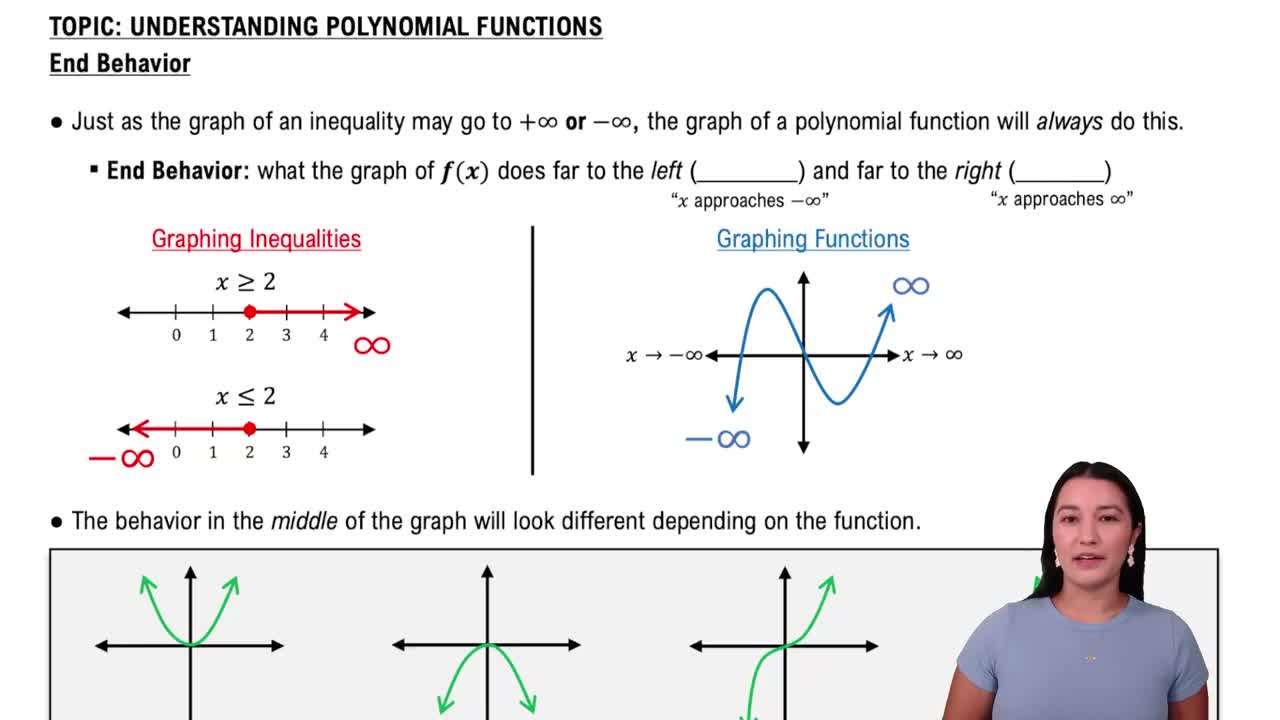
End Behavior of Polynomial Functions
관련 실천
교과서 질문
660
views
교과서 질문
Use the Leading Coefficient Test to determine the end behavior of the graph of the polynomial function.
1091
views
교과서 질문
Divide using synthetic division. (3x2+7x−20)÷(x+5)
563
views
교과서 질문
Solve each polynomial inequality in Exercises 1–42 and graph the solution set on a real number line. Express each solution set in interval notation.
639
views
교과서 질문
Use the vertex and intercepts to sketch the graph of each quadratic function. Give the equation of the parabola's axis of symmetry. Use the graph to determine the function's domain and range. f(x)=(x−1)2+2
838
views
교과서 질문
Write an equation that expresses each relationship. Then solve the equation for y. x varies directly as z and inversely as the sum of y and w.
571
views