Ch.10 - Chemical Bonding I: The Lewis Model
Tro - Chemistry: A Molecular Approach 6th Edition
Tro6th EditionChemistry: A Molecular ApproachISBN: 9780137832217당신이 사용하는 게 아니라요?교과서 변경
10장, 문제 62b

Refer to Figure 10.10 to estimate the percent ionic character of the ClF bond.
Scatter plot showing percent ionic character vs. electronegativity difference for various compounds.

검증된 단계별 안내
1
Identify the electronegativity difference between Cl and F. The electronegativity of Cl is approximately 3.0 and for F it is approximately 4.0.
Calculate the electronegativity difference: |4.0 - 3.0| = 1.0.
Locate the value of 1.0 on the x-axis (Electronegativity Difference) of the provided graph.
Find the corresponding point on the y-axis (Percent Ionic Character) that aligns with the electronegativity difference of 1.0.
Estimate the percent ionic character of the ClF bond by reading the y-axis value at the point where the electronegativity difference is 1.0.

비슷한 문제에 대한 검증된 영상 답변:

이 영상 해법은 위 문제에 도움이 된다고 튜터들이 추천한 것입니다.
영상 길이:
1m

주요 개념

질문에 올바르게 답하기 위해 반드시 이해해야 하는 핵심 개념들은 다음과 같습니다.

Ionic Character

Ionic character refers to the degree to which a bond between two atoms exhibits ionic properties, as opposed to covalent properties. It is influenced by the difference in electronegativity between the two atoms involved in the bond. A higher ionic character indicates a greater transfer of electrons from one atom to another, resulting in the formation of charged ions.
추천 영상:
가이드 코스
00:56
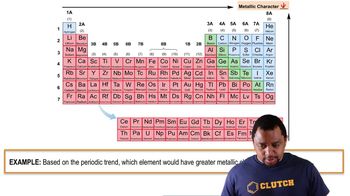
Metallic Character Example

Electronegativity Difference

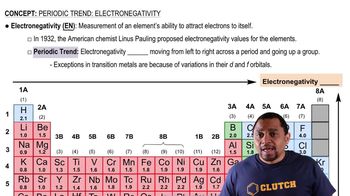
Electronegativity is a measure of an atom's ability to attract and hold onto electrons in a chemical bond. The electronegativity difference between two bonded atoms can help predict the bond's character; larger differences typically indicate more ionic character. For example, a difference greater than 1.7 often suggests an ionic bond, while smaller differences indicate covalent bonding.
추천 영상:
가이드 코스
02:10
Electronegativity Trends

Percent Ionic Character vs. Electronegativity Difference Graph

The graph plots percent ionic character against the electronegativity difference for various compounds, illustrating a trend where an increase in electronegativity difference correlates with higher percent ionic character. This visual representation helps in estimating the ionic character of specific bonds, such as the ClF bond, by locating its electronegativity difference on the x-axis and determining the corresponding ionic character on the y-axis.
추천 영상:
가이드 코스
00:56
Metallic Character Example