Ch 19: The First Law of Thermodynamics
Young & Freedman Calc - University Physics 14th Edition
Young & Freedman Calc14th EditionUniversity PhysicsISBN: 9780321973610당신이 사용하는 게 아니라요?교과서 변경
19장, 문제 1a

Two moles of an ideal gas are heated at constant pressure from T=27T = 27°C to T=107T = 107°C. Draw a pVpV-diagram for this process.

검증된 단계별 안내
1
Step 1: Understand the process described. The problem involves heating an ideal gas at constant pressure, which means the process is isobaric. In an isobaric process, the pressure remains constant while the volume changes as the temperature changes.
Step 2: Convert the given temperatures from Celsius to Kelvin, as thermodynamic calculations typically use the Kelvin scale. Use the formula: T(K) = T(°C) + 273.15. So, convert 27°C and 107°C to Kelvin.
Step 3: Use the ideal gas law to understand the relationship between pressure, volume, and temperature. The ideal gas law is given by: pV=nRT, where p is pressure, V is volume, n is the number of moles, R is the ideal gas constant, and T is temperature in Kelvin.
Step 4: Since the process is isobaric, the pressure p is constant. Therefore, the relationship between volume and temperature can be expressed as: VT=V'T', where V and T are the initial volume and temperature, and V' and T' are the final volume and temperature.
Step 5: To draw the pV-diagram, plot the initial and final states on a graph with pressure (p) on the y-axis and volume (V) on the x-axis. Since the pressure is constant, the line connecting the initial and final states will be horizontal, indicating an increase in volume as the temperature increases.

비슷한 문제에 대한 검증된 영상 답변:

이 영상 해법은 위 문제에 도움이 된다고 튜터들이 추천한 것입니다.
영상 길이:
2m

주요 개념

질문에 올바르게 답하기 위해 반드시 이해해야 하는 핵심 개념들은 다음과 같습니다.

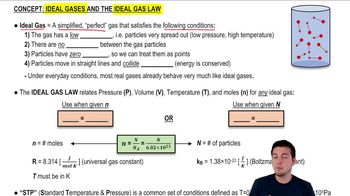
Ideal Gas Law

The Ideal Gas Law is a fundamental equation in thermodynamics, expressed as PV = nRT, where P is pressure, V is volume, n is the number of moles, R is the universal gas constant, and T is temperature in Kelvin. It describes the relationship between these variables for an ideal gas, allowing us to predict how changes in one variable affect the others.
추천 영상:
가이드 코스
07:21
Ideal Gases and the Ideal Gas Law

Constant Pressure Process

In a constant pressure process, the pressure of the gas remains unchanged while other variables, such as volume and temperature, may vary. For an ideal gas, as temperature increases at constant pressure, the volume must also increase according to the Ideal Gas Law, resulting in a linear relationship on a pV-diagram.
추천 영상:
가이드 코스
08:59
Phase Constant of a Wave Function

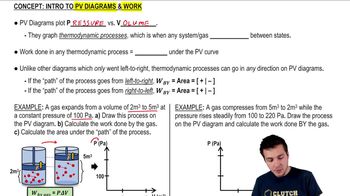
pV-Diagram

A pV-diagram is a graphical representation of the relationship between pressure (p) and volume (V) for a given thermodynamic process. For a constant pressure process, the diagram will show a horizontal line, indicating that pressure remains constant while volume changes. This visualization helps in understanding the behavior of gases during different thermodynamic processes.
추천 영상:
가이드 코스
08:07
Work and PV Diagrams