Ch. 5 - Normal Probability Distributions
Larson - Elementary Statistics: Picturing the World 8th Edition
Larson8th EditionElementary Statistics: Picturing the WorldISBN: 9780137493470당신이 사용하는 게 아니라요?교과서 변경
5장, 문제 5.R.69b

In Exercises 69 and 70, determine whether you can use a normal distribution to approximate the binomial distribution. If you can, use the normal distribution to approximate the indicated probabilities and sketch their graphs. If you cannot, explain why and use a binomial distribution to find the indicated probabilities.


A survey of U.S. adults found that 72% used a mobile device to manage their bank account at least once in the previous month. You randomly select 70 U.S. adults and ask whether they used a mobile device to manage their bank account at least once in the previous month. Find the probability that the number who have done so is (b) exactly 50.

검증된 단계별 안내
1
Step 1: Verify if the normal distribution can be used to approximate the binomial distribution. For this, check the conditions: (1) The sample size (n) should be large, and (2) both np and n(1-p) should be greater than or equal to 5. Here, n = 70 and p = 0.72. Calculate np = 70 × 0.72 and n(1-p) = 70 × (1 - 0.72).
Step 2: If the conditions are satisfied, proceed to approximate the binomial distribution using the normal distribution. The mean (μ) and standard deviation (σ) of the binomial distribution are given by μ = np and σ = √(np(1-p)). Calculate these values using the given n and p.
Step 3: Apply the continuity correction to account for the discrete nature of the binomial distribution. Since we are finding the probability of exactly 50 successes, use the interval [49.5, 50.5] for the normal approximation.
Step 4: Standardize the values using the z-score formula: z = (x - μ) / σ, where x represents the boundaries of the interval [49.5, 50.5]. Compute the z-scores for both 49.5 and 50.5.
Step 5: Use the standard normal distribution table (or a calculator) to find the probabilities corresponding to the z-scores. Subtract the smaller probability from the larger probability to find the probability of exactly 50 successes. Sketch the graph of the normal curve, shading the area between the z-scores.

비슷한 문제에 대한 검증된 영상 답변:

이 영상 해법은 위 문제에 도움이 된다고 튜터들이 추천한 것입니다.
영상 길이:
14m

주요 개념

질문에 올바르게 답하기 위해 반드시 이해해야 하는 핵심 개념들은 다음과 같습니다.

Binomial Distribution

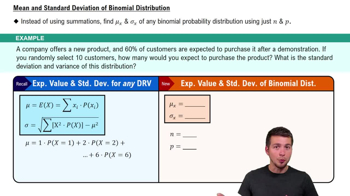
The binomial distribution models the number of successes in a fixed number of independent Bernoulli trials, each with the same probability of success. In this context, it applies to the scenario of randomly selecting U.S. adults and determining how many used a mobile device for banking. The parameters include the number of trials (n) and the probability of success (p), which in this case is 0.72.
추천 영상:
가이드 코스
03:28
Mean & Standard Deviation of Binomial Distribution

Normal Approximation to the Binomial

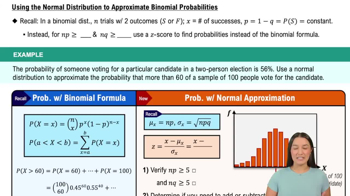
The normal approximation to the binomial distribution is applicable when the number of trials is large, and both np and n(1-p) are greater than 5. This allows us to use the normal distribution to estimate probabilities for binomial outcomes, simplifying calculations. In this case, we would check if the conditions are met to use the normal distribution for approximating the probability of exactly 50 successes.
추천 영상:
가이드 코스
06:23
Using the Normal Distribution to Approximate Binomial Probabilities

Probability Calculation

Calculating probability involves determining the likelihood of a specific outcome occurring within a defined set of possibilities. For the binomial distribution, this can be done using the binomial probability formula, which incorporates the number of successes, the total number of trials, and the probability of success. In this exercise, we would calculate the probability of exactly 50 adults using a mobile device for banking using either the binomial formula or the normal approximation if applicable.
추천 영상:
가이드 코스
07:09
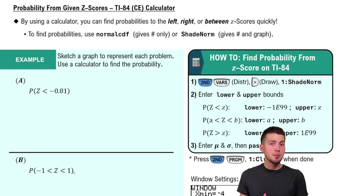
Probability From Given Z-Scores - TI-84 (CE) Calculator
관련 실천
교과서 질문

In Exercises 55–60, find the indicated probabilities and interpret the results.


The mean MCAT total score in a recent year is 500.9. A random sample of 32 MCAT total scores is selected. What is the probability that the mean score for the sample is (b) more than 502? Assume sigma=10.6.

69
views
교과서 질문

In Exercises 55–60, find the indicated probabilities and interpret the results.


The mean annual salary for Level 1 actuaries in the United States is about \$72,000. A random sample of 45 Level 1 actuaries is selected. What is the probability that the mean annual salary of the sample is (b) more than \$68,000? Assume sigma = \$11,000.

81
views
교과서 질문

In Exercises 53 and 54, find the mean and standard deviation of the indicated sampling distribution of sample means. Then sketch a graph of the sampling distribution.


The population densities in people per square mile in the 50 U.S. states have a mean of 199.6 and a standard deviation of 265.4. Random samples of size 35 are drawn from this population, and the mean of each sample is determined.

53
views
교과서 질문

In Exercises 69 and 70, determine whether you can use a normal distribution to approximate the binomial distribution. If you can, use the normal distribution to approximate the indicated probabilities and sketch their graphs. If you cannot, explain why and use a binomial distribution to find the indicated probabilities.


A survey of U.S. adults found that 72% used a mobile device to manage their bank account at least once in the previous month. You randomly select 70 U.S. adults and ask whether they used a mobile device to manage their bank account at least once in the previous month. Find the probability that the number who have done so is (a) at most 40.

124
views
교과서 질문

In Exercises 61 and 62, a binomial experiment is given. Determine whether you can use a normal distribution to approximate the binomial distribution. If you can, find the mean and standard deviation. If you cannot, explain why.


A survey of U.S. adults ages 33 to 40 earning more than \$150,000 per year found that 94% are content with how their lives have turned out so far. You randomly select 20 U.S. adults ages 33 to 40 earning more than \$150,000 and ask if they are content with their lives so far.

148
views
교과서 질문

In Exercises 55–60, find the indicated probabilities and interpret the results.


The mean annual salary for physical therapists in the United States is about \$87,000. A random sample of 50 physical therapists is selected. What is the probability that the mean annual salary of the sample is (b) more than \$85,000? Assume sigma = \$10,500.

67
views