Ch. 6 - Confidence Intervals
Larson - Elementary Statistics: Picturing the World 8th Edition
Larson8th EditionElementary Statistics: Picturing the WorldISBN: 9780137493470당신이 사용하는 게 아니라요?교과서 변경
6장, 문제 6.R.13

In Exercises 13–16, (a) find the margin of error for the values of c, s, and n, and (b) construct the confidence interval for using the t-distribution. Assume the population is normally distributed.
c = 0.90, s = 25.6, n = 16, xbar = 72.1

검증된 단계별 안내
1
Step 1: Identify the given values and understand the problem. Here, c = 0.90 (confidence level), s = 25.6 (sample standard deviation), n = 16 (sample size), and x̄ = 72.1 (sample mean). The goal is to calculate the margin of error and construct the confidence interval using the t-distribution.
Step 2: Calculate the degrees of freedom (df) for the t-distribution. The formula is df = n - 1. Substitute n = 16 into the formula to find df.
Step 3: Determine the critical t-value (t*) for the given confidence level (c = 0.90) and degrees of freedom (df). Use a t-distribution table or statistical software to find t* corresponding to a two-tailed test with a 90% confidence level.
Step 4: Compute the margin of error (E) using the formula E = t* × (s / √n). Substitute the values of t*, s = 25.6, and n = 16 into the formula. Simplify the expression to find E.
Step 5: Construct the confidence interval for the population mean (μ) using the formula: Confidence Interval = x̄ ± E. Substitute x̄ = 72.1 and the calculated margin of error (E) into the formula to express the confidence interval.

비슷한 문제에 대한 검증된 영상 답변:

이 영상 해법은 위 문제에 도움이 된다고 튜터들이 추천한 것입니다.
영상 길이:
5m

주요 개념

질문에 올바르게 답하기 위해 반드시 이해해야 하는 핵심 개념들은 다음과 같습니다.

Margin of Error

The margin of error quantifies the uncertainty in a sample estimate. It is calculated using the formula: Margin of Error = t * (s / √n), where t is the t-score corresponding to the desired confidence level, s is the sample standard deviation, and n is the sample size. A smaller margin of error indicates a more precise estimate of the population parameter.
추천 영상:
가이드 코스
04:08
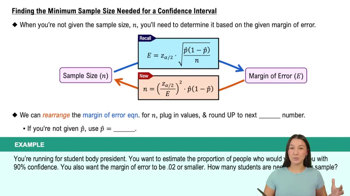
Finding the Minimum Sample Size Needed for a Confidence Interval

Confidence Interval

A confidence interval is a range of values, derived from a sample, that is likely to contain the population parameter with a specified level of confidence. It is constructed using the formula: Confidence Interval = x̄ ± Margin of Error, where x̄ is the sample mean. For a 90% confidence level, the interval provides a range where we expect the true population mean to fall.
추천 영상:
가이드 코스
06:33
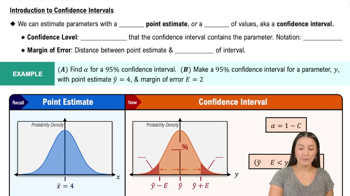
Introduction to Confidence Intervals

t-Distribution

The t-distribution is a probability distribution used when estimating population parameters when the sample size is small (typically n < 30) and the population standard deviation is unknown. It is similar to the normal distribution but has heavier tails, which accounts for the increased variability in smaller samples. The t-score is used in calculating the margin of error and confidence intervals.
추천 영상:
가이드 코스
05:50
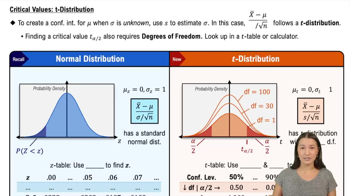
Critical Values: t-Distribution
관련 실천
교과서 질문

(a) Construct a 90% confidence interval for the population mean in Exercise 1. Interpret the results. (b) Does it seem likely that the population mean could be within 10% of the sample mean? Explain.

170
views

교과서 질문

In a random sample of 36 top-rated roller coasters, the average height is 165 feet and the standard deviation is 67 feet. Construct a 90% confidence interval for μ. Interpret the results. (Source: POP World Media, LLC)

92
views
교과서 질문

In Exercises 5 and 6, use the confidence interval to find the margin of error and the sample mean.

(20.75, 24.10)

82
views
교과서 질문

You wish to estimate, with 95% confidence, the population proportion of U.S. adults who have taken or planned to take a winter vacation in a recent year. Your estimate must be accurate within 5% of the population proportion.

b. Find the minimum sample size needed, using a prior study that found that 32% of U.S. adults have taken or planned to take a winter vacation in a recent year. (Source: Rasmussen Reports)

88
views
교과서 질문

In Exercises 19–22, let p be the population proportion for the situation. (a) Find point estimates of p and q, (b) construct 90% and 95% confidence intervals for p, and (c) interpret the results of part (b) and compare the widths of the confidence intervals.

In a survey of 73,901 college graduates, 23,991 obtained a postgraduate degree. (Adapted from Gallup)

96
views
교과서 질문

In Exercise 19, would it be unusual for the population proportion to be 38%? Explain.

90
views