Ch. 7 - Hypothesis Testing with One Sample
Larson - Elementary Statistics: Picturing the World 8th Edition
Larson8th EditionElementary Statistics: Picturing the WorldISBN: 9780137493470당신이 사용하는 게 아니라요?교과서 변경
7장, 문제 7.3.17

In Exercises 13–18, test the claim about the population mean μ at the level of significance α. Assume the population is normally distributed.
Claim: μ=4915; α=0.01. Sample statistics: x_bar=5017, s=5613, n=51

검증된 단계별 안내
1
Step 1: Identify the null hypothesis (H₀) and the alternative hypothesis (Hₐ). The null hypothesis is H₀: μ = 4915, and the alternative hypothesis is Hₐ: μ ≠ 4915 (two-tailed test).
Step 2: Calculate the test statistic using the formula for a t-test: t = (x̄ - μ) / (s / √n), where x̄ is the sample mean, μ is the population mean under the null hypothesis, s is the sample standard deviation, and n is the sample size.
Step 3: Determine the degrees of freedom (df) for the t-distribution. The formula is df = n - 1, where n is the sample size.
Step 4: Find the critical t-value(s) for a two-tailed test at the significance level α = 0.01 using a t-distribution table or statistical software. Compare the calculated t-value from Step 2 to the critical t-value(s).
Step 5: Make a decision. If the absolute value of the calculated t-value is greater than the critical t-value, reject the null hypothesis H₀. Otherwise, fail to reject H₀. Interpret the result in the context of the claim.

비슷한 문제에 대한 검증된 영상 답변:

이 영상 해법은 위 문제에 도움이 된다고 튜터들이 추천한 것입니다.
영상 길이:
5m

주요 개념

질문에 올바르게 답하기 위해 반드시 이해해야 하는 핵심 개념들은 다음과 같습니다.

Hypothesis Testing

Hypothesis testing is a statistical method used to make decisions about a population based on sample data. It involves formulating a null hypothesis (H0) and an alternative hypothesis (H1), then using sample statistics to determine whether to reject H0 in favor of H1. In this case, the null hypothesis is that the population mean μ equals 4915.
추천 영상:
가이드 코스
06:21
Step 1: Write Hypotheses

Level of Significance (α)

The level of significance, denoted as α, is the threshold for determining whether to reject the null hypothesis. It represents the probability of making a Type I error, which occurs when the null hypothesis is incorrectly rejected. In this scenario, α is set at 0.01, indicating a 1% risk of concluding that a difference exists when there is none.
추천 영상:
가이드 코스
04:46
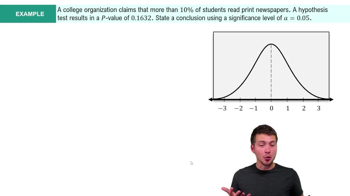
Step 4: State Conclusion Example 4

Sample Statistics

Sample statistics are numerical values calculated from a sample that provide insights into the population from which the sample is drawn. In this question, the sample mean (x̄ = 5017), sample standard deviation (s = 5613), and sample size (n = 51) are crucial for conducting the hypothesis test and determining whether the observed sample mean significantly differs from the claimed population mean.
추천 영상:
가이드 코스
05:11
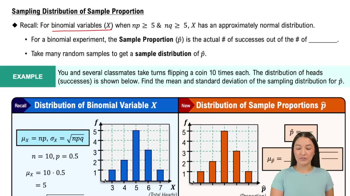
Sampling Distribution of Sample Proportion
관련 실천
교과서 질문

Identifying Type I and Type II Errors In Exercises 31–36, describe type I and type II errors for a hypothesis test of the indicated claim.


Repeat Customers A used textbook selling website claims that at least 60% of its new customers will return to buy their next textbook.

101
views
교과서 질문

Identifying the Nature of a Hypothesis Test In Exercises 37–42, state and in words and in symbols. Then determine whether the hypothesis test is left-tailed, right-tailed, or two-tailed. Explain your reasoning. Sketch a normal sampling distribution and shade the area for the P-value.


Survey A polling organization reports that the number of responses to a survey mailed to 100,000 U.S. residents is not 100,000.

58
views
교과서 질문

Finding a P-Value In Exercises 13–18, find the P-value for the hypothesis test with the standardized test statistic z. Decide whether to reject H0 for the level of significance alpha.

Left-tailed test


z= 1.95

alpha=0.08

57
views
교과서 질문

Hypothesis Testing Using Rejection Regions In Exercises 7–12, (a) identify the claim and state H0 and Ha, (b) find the critical value(s) and identify the rejection region(s), (c) find the standardized test statistic z, (d) decide whether to reject or fail to reject the null hypothesis, and (e) interpret the decision in the context of the original claim.


Changing Jobs A researcher claims that 40% of U.S. adults would consider changing jobs. In a random sample of 50 U.S. adults, 25 say they would consider changing jobs. At α=0.10, is there enough evidence to reject the researcher’s claim?

77
views
교과서 질문

Stating Hypotheses In Exercises 11–16, the statement represents a claim. Write its complement and state which is H0 and which is Ha.


μ < 128

47
views
교과서 질문

Stating Hypotheses In Exercises 11–16, the statement represents a claim. Write its complement and state which is H0 and which is Ha.


p = 0.21

66
views