Ch. 9 - Correlation and Regression
Larson - Elementary Statistics: Picturing the World 8th Edition
Larson8th EditionElementary Statistics: Picturing the WorldISBN: 9780137493470당신이 사용하는 게 아니라요?교과서 변경
9장, 문제 9.1.31

In Exercise 25, remove the data for the international soccer player with a maximum weight of 170 kilograms and a jump height of 64 centimeters. Describe how this affects the correlation coefficient r.

검증된 단계별 안내
1
Recall that the correlation coefficient r measures the strength and direction of the linear relationship between two variables—in this case, weight and jump height.
Identify that the data point with a weight of 170 kilograms and a jump height of 64 centimeters is an outlier because the weight is unusually high compared to typical values.
Understand that outliers can have a strong influence on the correlation coefficient, often pulling the value of r toward themselves and potentially inflating or deflating the correlation.
By removing this outlier, recalculate the correlation coefficient r using the remaining data points to see how the linear relationship changes without the extreme value.
Compare the new correlation coefficient to the original one to describe whether the strength of the linear relationship has increased, decreased, or remained about the same after removing the outlier.

비슷한 문제에 대한 검증된 영상 답변:

이 영상 해법은 위 문제에 도움이 된다고 튜터들이 추천한 것입니다.
영상 길이:
2m

주요 개념

질문에 올바르게 답하기 위해 반드시 이해해야 하는 핵심 개념들은 다음과 같습니다.

Correlation Coefficient (r)

The correlation coefficient measures the strength and direction of a linear relationship between two variables, ranging from -1 to 1. A value close to 1 or -1 indicates a strong linear relationship, while a value near 0 suggests little to no linear association.
추천 영상:
가이드 코스
05:43
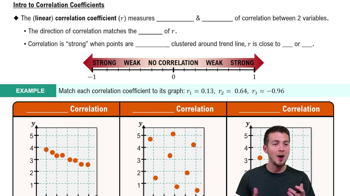
Correlation Coefficient

Influence of Outliers on Correlation

Outliers are data points that differ significantly from others and can disproportionately affect the correlation coefficient. Removing an outlier can increase or decrease the value of r, depending on whether the outlier was strengthening or weakening the linear relationship.
추천 영상:
가이드 코스
05:43
Correlation Coefficient

Data Cleaning and Its Impact on Statistical Measures

Data cleaning involves removing or correcting inaccurate or irrelevant data points to improve analysis quality. Eliminating extreme values, like the player with max weight and low jump height, can lead to a more representative correlation coefficient that better reflects the typical relationship in the dataset.
추천 영상:
가이드 코스
04:39
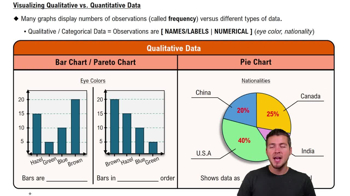
Visualizing Qualitative vs. Quantitative Data
관련 실천
교과서 질문

Graphical Analysis In Exercises 11–14, determine whether there is a perfect positive linear correlation, a strong positive linear correlation, a perfect negative linear correlation, a strong negative linear correlation, or no linear correlation between the variables.

65
views
교과서 질문

"[APPLET] Registered Nurse Salaries In Exercises 27–30, use the table, which shows the years of experience of 14 registered nurses and their annual salaries (in thousands of dollars). (Adapted from Payscale, Inc.)

27. Correlation Using the scatter plot of the registered nurse salary data shown below, what type of correlation, if any, do you think the data have? Explain.


"

82
views
교과서 질문

"In Exercises 7-12, match the description in the left column with its symbol(s) in the right column.

9. Slope

a. \(\hat{y}\)_i

b. y_i

c. b

d. (\(\bar{x}\), \(\bar{y}\))

e. m

f. \(\bar{y}\)"

51
views
교과서 질문

8. In your own words, what does it mean to say "correlation does not imply causation"? List a pair of variables that have correlation but no cause-and-effect relationship.

141
views
교과서 질문

"In Exercises 9 and 10, identify the explanatory variable and the response variable.

9. A nutritionist wants to determine whether the amounts of water consumed each day by persons of the same weight and on the same diet can be used to predict individual weight

loss."

79
views
교과서 질문

"In Exercises 7-12, match the description in the left column with its symbol(s) in the right column.

12. The point a regression line always passes through

a. \(\hat{y}\)_i

b. y_i

c. b

d. (\(\bar{x}\), \(\bar{y}\))

e. m

f. \(\bar{y}\)"

51
views