


Ch. 12 - Analysis of Variance
Triola - Elementary Statistics 14th Edition
Triola14th EditionElementary StatisticsISBN: 9780137366446당신이 사용하는 게 아니라요?교과서 변경
12장, 문제 12.c.1d

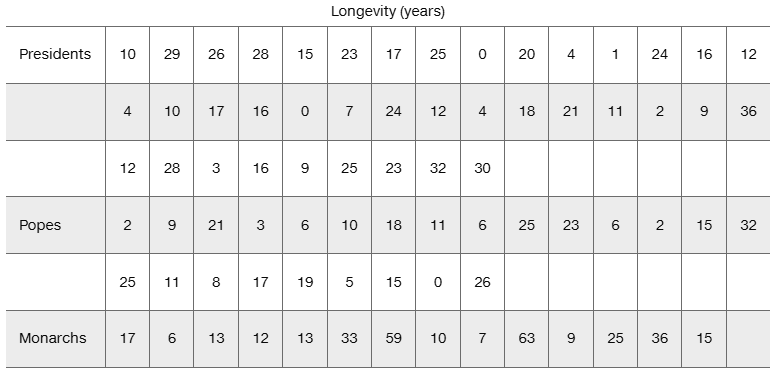
In Exercises 1–5, refer to the following list of numbers of years that deceased U.S. presidents, popes, and British monarchs lived after their inauguration, election, or coronation, respectively. (As of this writing, the last president is George H. W. Bush, the last pope is John Paul II, and the last British monarch is George VI.) Assume that the data are samples from larger populations.


[Image]


Exploring the Data Include appropriate units in all answers.


d. Are there any obvious outliers?

검증된 단계별 안내
1
Step 1: Organize the data for each group (Presidents, Popes, and Monarchs) into separate lists. This will help in analyzing the data for potential outliers.
Step 2: Calculate the mean (average) and standard deviation for each group. The mean is calculated as the sum of all data points divided by the number of data points, and the standard deviation measures the spread of the data around the mean.
Step 3: Identify potential outliers using the 1.5 * IQR (Interquartile Range) rule. First, calculate the quartiles (Q1 and Q3) for each group. Then, compute the IQR as Q3 - Q1. Any data point below Q1 - 1.5 * IQR or above Q3 + 1.5 * IQR is considered an outlier.
Step 4: Compare the identified outliers (if any) with the data points in the table. Highlight any values that fall significantly outside the range determined in Step 3.
Step 5: Summarize the findings, specifying which group(s) have outliers, the values of those outliers, and their implications in the context of the data (e.g., unusually long or short longevity after inauguration, election, or coronation).

비슷한 문제에 대한 검증된 영상 답변:

이 영상 해법은 위 문제에 도움이 된다고 튜터들이 추천한 것입니다.
영상 길이:
3m

주요 개념

질문에 올바르게 답하기 위해 반드시 이해해야 하는 핵심 개념들은 다음과 같습니다.

Outliers

Outliers are data points that significantly differ from the other observations in a dataset. They can be unusually high or low values that may indicate variability in the measurement or may suggest a need for further investigation. Identifying outliers is crucial as they can skew statistical analyses and affect the results, leading to potentially misleading conclusions.
추천 영상:
가이드 코스
04:48
Comparing Mean vs. Median

Descriptive Statistics

Descriptive statistics summarize and describe the main features of a dataset. This includes measures such as mean, median, mode, range, and standard deviation, which provide insights into the central tendency and variability of the data. Understanding these statistics is essential for interpreting the data effectively and making informed decisions based on the analysis.
추천 영상:
가이드 코스
05:53
Parameters vs. Statistics

Box Plot

A box plot is a graphical representation that displays the distribution of a dataset based on five summary statistics: minimum, first quartile, median, third quartile, and maximum. It visually highlights the central tendency and variability, as well as potential outliers. Box plots are particularly useful for comparing distributions across different groups, making them a valuable tool in exploratory data analysis.
추천 영상:
가이드 코스
04:01
Creating Dotplots