Ch. 6 - Normal Probability Distributions
Triola - Elementary Statistics 14th Edition
Triola14th EditionElementary StatisticsISBN: 9780137366446당신이 사용하는 게 아니라요?교과서 변경
6장, 문제 6.CR.3a

Foot Lengths of Women Assume that foot lengths of adult females are normally distributed with a mean of 246.3 mm and a standard deviation of 12.4 mm (based on Data Set 3 “ANSUR II 2012” in Appendix B).


a. Find the probability that a randomly selected adult female has a foot length less than 221.5 mm.

검증된 단계별 안내
1
Step 1: Identify the given parameters of the normal distribution. The mean (μ) is 246.3 mm, and the standard deviation (σ) is 12.4 mm. The problem asks for the probability that a randomly selected adult female has a foot length less than 221.5 mm.
Step 2: Standardize the value 221.5 mm to a z-score using the z-score formula: z = (X - μ) / σ. Here, X is the value of interest (221.5 mm), μ is the mean (246.3 mm), and σ is the standard deviation (12.4 mm). Substitute the values into the formula.
Step 3: Once the z-score is calculated, use a standard normal distribution table (z-table) or a statistical software to find the cumulative probability corresponding to the calculated z-score. This cumulative probability represents the probability that a randomly selected adult female has a foot length less than 221.5 mm.
Step 4: Interpret the cumulative probability obtained from the z-table or software. This value is the probability that a randomly selected adult female has a foot length less than 221.5 mm.
Step 5: If required, express the probability as a percentage by multiplying the cumulative probability by 100. This step is optional and depends on how the final answer needs to be presented.

비슷한 문제에 대한 검증된 영상 답변:

이 영상 해법은 위 문제에 도움이 된다고 튜터들이 추천한 것입니다.
영상 길이:
1m

주요 개념

질문에 올바르게 답하기 위해 반드시 이해해야 하는 핵심 개념들은 다음과 같습니다.

Normal Distribution

Normal distribution is a probability distribution that is symmetric about the mean, showing that data near the mean are more frequent in occurrence than data far from the mean. It is characterized by its bell-shaped curve, defined by its mean and standard deviation. In this context, the foot lengths of adult females follow a normal distribution, which allows us to use statistical methods to find probabilities related to specific values.
추천 영상:
가이드 코스
09:47
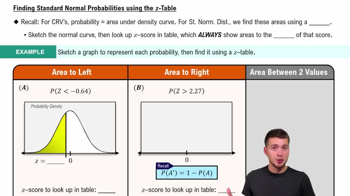
Finding Standard Normal Probabilities using z-Table

Z-Score

A Z-score is a statistical measurement that describes a value's relationship to the mean of a group of values. It is calculated by subtracting the mean from the value and then dividing by the standard deviation. In this question, calculating the Z-score for a foot length of 221.5 mm will help determine how many standard deviations this value is from the mean, which is essential for finding the corresponding probability in the normal distribution.
추천 영상:
가이드 코스
06:31
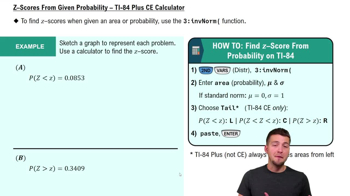
Z-Scores From Given Probability - TI-84 (CE) Calculator

Probability

Probability is a measure of the likelihood that an event will occur, expressed as a number between 0 and 1. In the context of this question, we are interested in finding the probability that a randomly selected adult female has a foot length less than 221.5 mm. This involves using the Z-score to reference standard normal distribution tables or software to find the cumulative probability associated with that Z-score.
추천 영상:
가이드 코스
5:37
Introduction to Probability
관련 실천
교과서 질문

Standard Normal Distribution. In Exercises 13–16, find the indicated z score. The graph depicts the standard normal distribution of bone density scores with mean 0 and standard deviation 1.


265
views

교과서 질문

Basis for the Range Rule of Thumb and the Empirical Rule. In Exercises 45–48, find the indicated area under the curve of the standard normal distribution; then convert it to a percentage and fill in the blank. The results form the basis for the range rule of thumb and the empirical rule introduced in Section 3-2.


About __ % of the area is between z = -3.5 and z = 3.5 (or within 3.5 standard deviation of the mean).

184
views
교과서 질문

In Exercises 1 and 2, use the following wait times (minutes) at 10:00 AM for the Tower of Terror ride at Disney World (from Data Set 33 “Disney World Wait Times” in Appendix B).


35 35 20 50 95 75 45 50 30 35 30 30


h. Are the wait times discrete data or continuous data?

272
views
교과서 질문

Normal Distribution Using a larger data set than the one given for the preceding exercises, assume that cell phone radiation amounts are normally distributed with a mean of 1.17 W/kg and a standard deviation of 0.29 W/kg.

a. Find the probability that a randomly selected cell phone has a radiation amount that exceeds the U.S. standard of 1.6 W/kg or less.

115
views
교과서 질문

Foot Lengths of Women Assume that foot lengths of adult females are normally distributed with a mean of 246.3 mm and a standard deviation of 12.4 mm (based on Data Set 3 “ANSUR II 2012” in Appendix B).


c. Find P95.

115
views
교과서 질문

In Exercises 1 and 2, use the following wait times (minutes) at 10:00 AM for the Tower of Terror ride at Disney World (from Data Set 33 “Disney World Wait Times” in Appendix B).


35 35 20 50 95 75 45 50 30 35 30 30 


b. Find the median.

132
views