Ch. 30 - An Introduction to Animals
Freeman - Biological Science 8th Edition
Freeman8th EditionBiological ScienceISBN: 9780138276263당신이 사용하는 게 아니라요?교과서 변경
30장, 문제 11

The vast majority of animals that ever existed are now extinct, but Tereza Jezkova and John Wiens wondered which variables were most important in driving the diversification of species that exist today.
Why are there so many species in some phyla, such as Cnidaria (see photo), but so few in others, such as Ctenophora?
Draw a horizontal axis to represent the number of species within phyla using a logarithmic scale (1, 10, 100, 1000 species, etc.). Then use Table 30.1 to map seven representative phyla from small to large at intervals of about an order of magnitude on this scale.

검증된 단계별 안내
1
Step 1: Understand the problem. The goal is to represent the number of species within seven phyla on a logarithmic scale. A logarithmic scale is useful for visualizing data that spans several orders of magnitude, as it compresses large values while preserving their relative differences.
Step 2: Analyze the provided graph. The graph shows the number of species identified for seven phyla: Sponges, Mollusks, Flatworms, Jellyfish (Cnidaria), Chordates, Roundworms, and Arthropods. Note the approximate number of species for each phylum from the graph.
Step 3: Convert the species counts into logarithmic values. For example, if a phylum has 10,000 species, its logarithmic value is log10(10,000) = 4. Repeat this for all phyla using their respective species counts.
Step 4: Draw a horizontal axis labeled 'Number of Species (Log Scale)' with intervals such as 1, 10, 100, 1000, and 10,000. Place each phylum on the axis based on its logarithmic value. For example, Sponges might fall closer to 1, while Arthropods might fall closer to 10,000.
Step 5: Map the seven phyla on the axis at intervals of about an order of magnitude. Ensure the placement reflects the relative differences in species counts as shown in the graph. For example, Arthropods will be farthest to the right, while Sponges will be farthest to the left.

비슷한 문제에 대한 검증된 영상 답변:

이 영상 해법은 위 문제에 도움이 된다고 튜터들이 추천한 것입니다.
영상 길이:
49s

주요 개념

질문에 올바르게 답하기 위해 반드시 이해해야 하는 핵심 개념들은 다음과 같습니다.

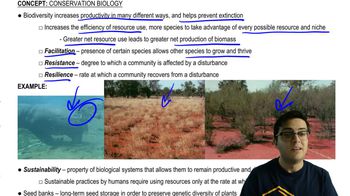
Biodiversity

Biodiversity refers to the variety of life forms within a given ecosystem, biome, or on the entire planet. It encompasses the diversity of species, genetic variations, and the ecosystems they inhabit. High biodiversity often indicates a healthy ecosystem, while low biodiversity can signal environmental stress or degradation. Understanding biodiversity is crucial for studying species distribution and the factors influencing their survival and evolution.
추천 영상:
05:06
Biodiversity and Sustainability

Phylogenetic Relationships

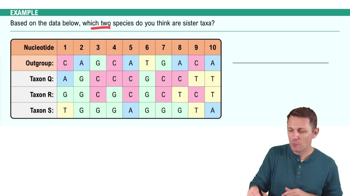
Phylogenetic relationships illustrate the evolutionary connections between different species or groups of organisms. These relationships are often depicted in phylogenetic trees, which show how species diverged from common ancestors over time. Analyzing these relationships helps scientists understand the evolutionary history of species, including why certain phyla, like Cnidaria, have more species than others, such as Ctenophora.
추천 영상:
가이드 코스
04:13
Building Phylogenetic Trees Example 2

Ecological Niches

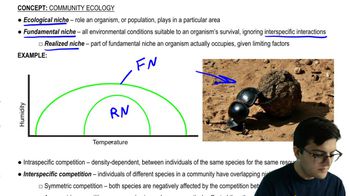
An ecological niche describes the role and position a species has in its environment, including its habitat, resource use, and interactions with other organisms. Different species occupy different niches, which can lead to varying levels of species richness within phyla. Factors such as competition, predation, and environmental conditions influence how many species can coexist in a given niche, contributing to the observed diversity among different phyla.
추천 영상:
02:48
Ecological Niches and Competition