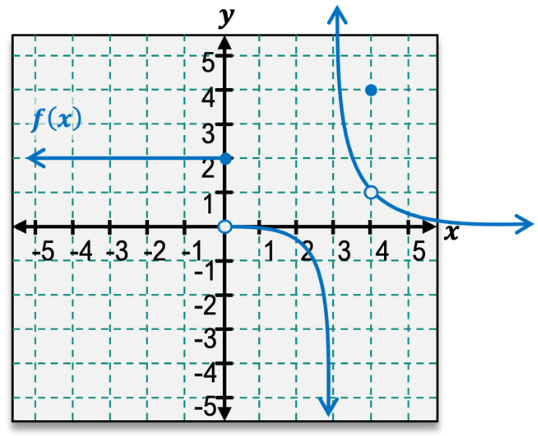
Use the graph of f(x) to determine if the function is continuous or discontinuous at x=c. c=−2
A
Continuous
B
Discontinuous
0 댓글
검증된 단계별 안내
1
Step 1: Recall the definition of continuity at a point x = c. A function f(x) is continuous at x = c if the following three conditions are satisfied: (1) f(c) is defined, (2) the limit of f(x) as x approaches c exists, and (3) the limit of f(x) as x approaches c is equal to f(c).
Step 2: Analyze the graph at x = -2. Check if there is a point on the graph at x = -2. From the graph, observe that there is a filled circle at x = -2, indicating that f(-2) is defined.
Step 3: Determine if the limit of f(x) as x approaches -2 exists. Observe the behavior of the graph as x approaches -2 from both the left and the right. The graph approaches the same y-value from both sides, indicating that the limit exists.
Step 4: Verify if the limit of f(x) as x approaches -2 is equal to f(-2). From the graph, the y-value of the function at x = -2 matches the value approached by the graph from both sides, satisfying the third condition for continuity.
Step 5: Conclude that the function f(x) is continuous at x = -2 because all three conditions for continuity are satisfied.


 검증된 단계별 안내

