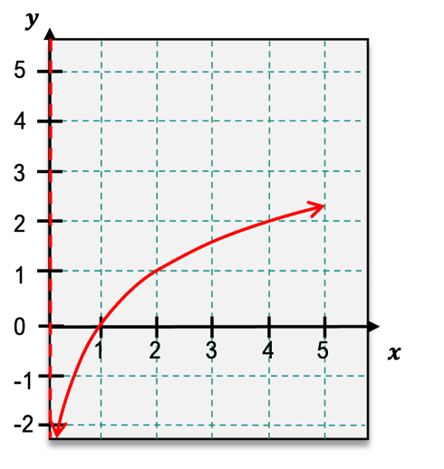
For the following graph, find the open intervals for which the function is concave up or concave down. Identify any inflection points.
목차
- 0. Functions4h 53m
- 1. Limits and Continuity2h 2m
- 2. Intro to Derivatives1h 33m
- 3. Techniques of Differentiation2h 18m
- 4. Derivatives of Exponential & Logarithmic Functions1h 16m
- 5. Applications of Derivatives2h 19m
- 6. Graphical Applications of Derivatives6h 0m
- 7. Antiderivatives & Indefinite Integrals48m
- 8. Definite Integrals4h 36m
- 9. Graphical Applications of Integrals1h 43m
- 10. Integrals of Inverse, Exponential, & Logarithmic Functions21m
- 11. Techniques of Integration2h 7m
- 12. Trigonometric Functions6h 54m
- Angles29m
- Trigonometric Functions on Right Triangles1h 8m
- Solving Right Triangles23m
- Trigonometric Functions on the Unit Circle1h 19m
- Graphs of Sine & Cosine46m
- Graphs of Other Trigonometric Functions32m
- Trigonometric Identities52m
- Derivatives of Trig Functions42m
- Integrals of Basic Trig Functions28m
- Integrals of Other Trig Functions10m
- 13: Intro to Differential Equations2h 23m
- 14. Sequences & Series2h 8m
- 15. Power Series2h 19m
- 16. Probability & Calculus45m
6. Graphical Applications of Derivatives
Concavity
객관식
For the following graph, find the open intervals for which the function is concave up or concave down. Identify any inflection points.

A
Concave down: (0,∞); No inflection pt
B
Concave down: (0,∞); Inflection pt: (0,0)
C
Concave up: (−∞,0); Concave down: (0,∞); Inflection pt: (0,0)
D
Concave down: (−∞,∞); No inflection pt
0 댓글
검증된 단계별 안내1
Step 1: Observe the graph and identify the behavior of the curve. The graph shows a function that starts steeply decreasing and then transitions to a gentler slope as x increases.
Step 2: Recall that concavity is determined by the second derivative of the function. If the second derivative is positive, the function is concave up; if negative, the function is concave down.
Step 3: Analyze the graph visually. From x = -∞ to x = 0, the curve appears to be concave up because the slope is increasing (becoming less steep). From x = 0 to x = ∞, the curve appears to be concave down because the slope is decreasing (becoming flatter).
Step 4: Identify the inflection point. An inflection point occurs where the concavity changes, which is at x = 0 in this graph. At this point, the function transitions from concave up to concave down.
Step 5: Summarize the intervals of concavity and the inflection point. The function is concave up on (-∞, 0), concave down on (0, ∞), and has an inflection point at (0, 0).
관련 영상
관련 실천
객관식
160
views