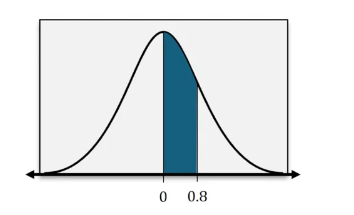
Find the area of the shaded region under the standard normal distribution.
A
0.7881
B
0.7119
C
0.2119
D
0.2881
0 댓글
검증된 단계별 안내
1
Understand that the shaded region under the standard normal distribution curve represents the probability between two z-scores. In this case, the z-scores are 0 and 0.8.
Recall that the standard normal distribution is symmetric around the mean, which is 0, and has a standard deviation of 1. The total area under the curve is 1.
Use the standard normal distribution table (z-table) to find the cumulative probability for z = 0.8. This value represents the area under the curve from the far left up to z = 0.8.
Find the cumulative probability for z = 0 using the z-table. This value represents the area under the curve from the far left up to z = 0.
Subtract the cumulative probability at z = 0 from the cumulative probability at z = 0.8 to find the area of the shaded region between these two z-scores.


 검증된 단계별 안내

