Boxplots
- 작성 시간을 절약하려면 워크시트를 다운로드하세요
- 연습 문제를 풀기 시작해
- 막히면 영상 해답을 보세요
- 더 많은 인사이트를 원하시면 요약을 참고하세요

Boxplots
5 문제점
문제 3객관식
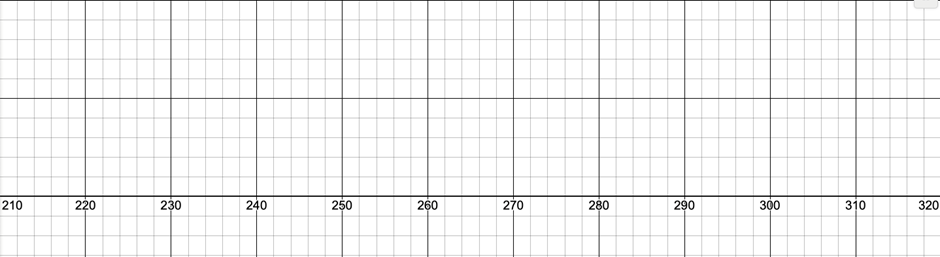
Use the given data to construct a boxplot and identify the 5-number summary.
Reaction Times: A group of 14 students participated in a reflex test, where their reaction times (in milliseconds) were recorded. The recorded reaction times are as follows:
문제 4객관식
i. Identify any outliers
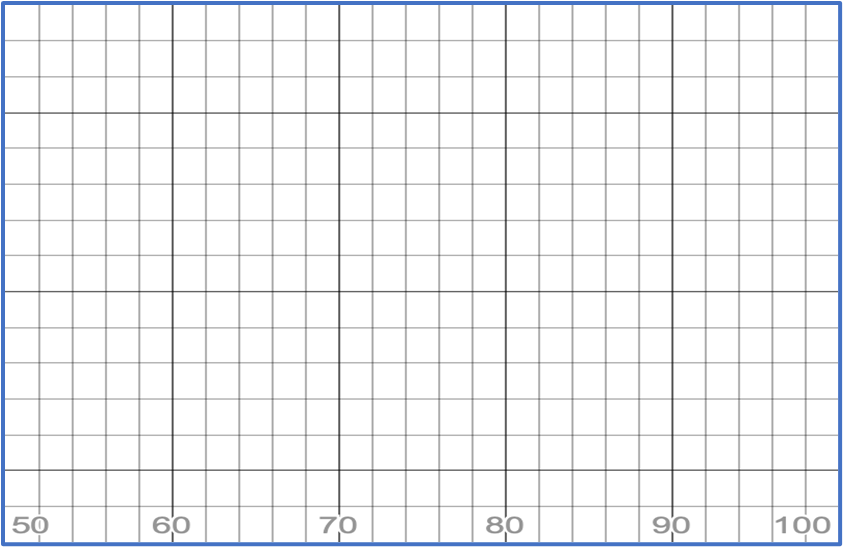
ii. Draw a modified box-and-whisker plot that represents the following data set.
, , , , , , , , , , ,
문제 5객관식
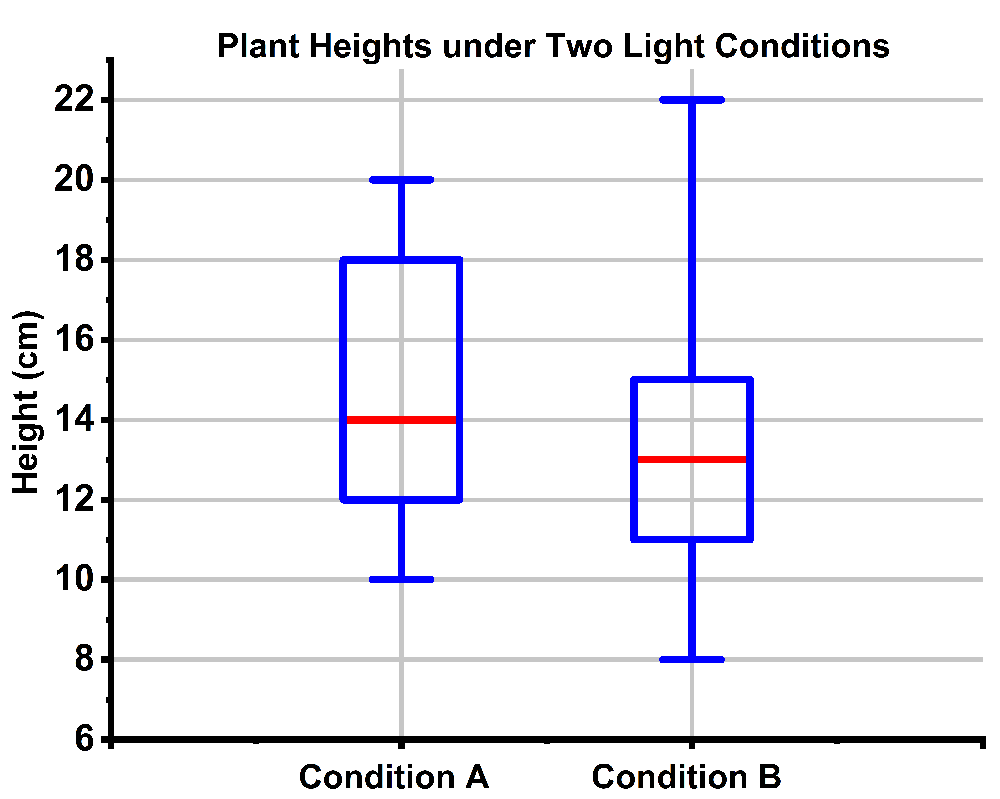
The heights (in centimeters) of plants grown under two different light conditions, Condition A and Condition B, are shown using side-by-side box and whisker plots. Describe the distribution shape for each condition and state which condition exhibits more consistent plant heights.