- 작성 시간을 절약하려면 워크시트를 다운로드하세요
- 연습 문제를 풀기 시작해
- 막히면 영상 해답을 보세요
- 더 많은 인사이트를 원하시면 요약을 참고하세요

A researcher is studying the relationship between hours of weekly exercise and resting heart rate (in beats per minute) among a group of adults. The data for 8 participants is shown below:
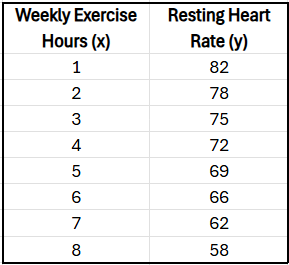
The correlation coefficient for the data is , indicating a strong negative linear relationship: more exercise is associated with a lower resting heart rate. The researcher decides to remove the data for the participant who exercised 1 hour per week and had a heart rate of . How would removing this data point most likely affect the correlation coefficient ?
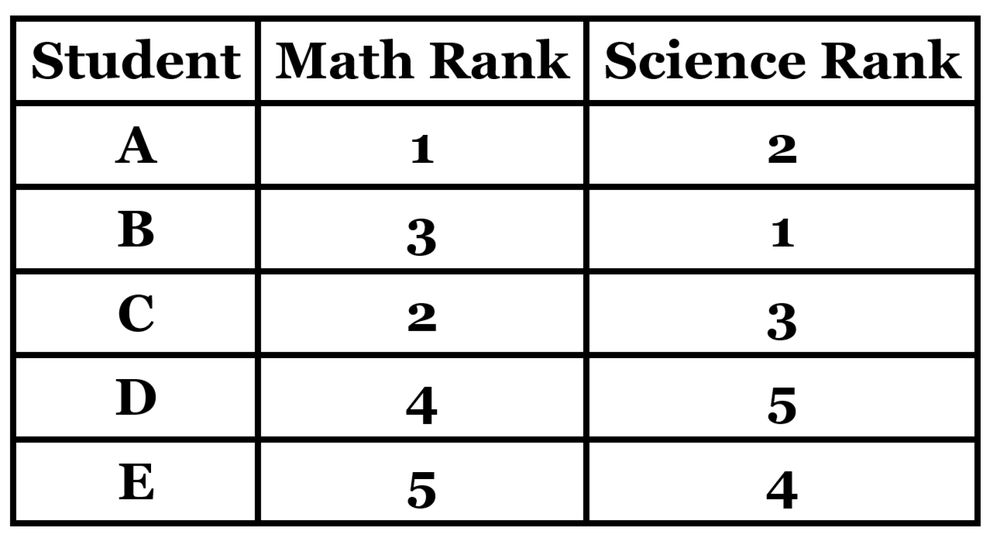
Use the ranks from the data provided below to calculate the Spearman rank correlation coefficient. Then, using a significance level, find the critical value and determine whether there is a statistically significant correlation between the two variables.
The following table lists battery life (in hours of continuous usage) and prices (in US dollars) for different smartphone models.
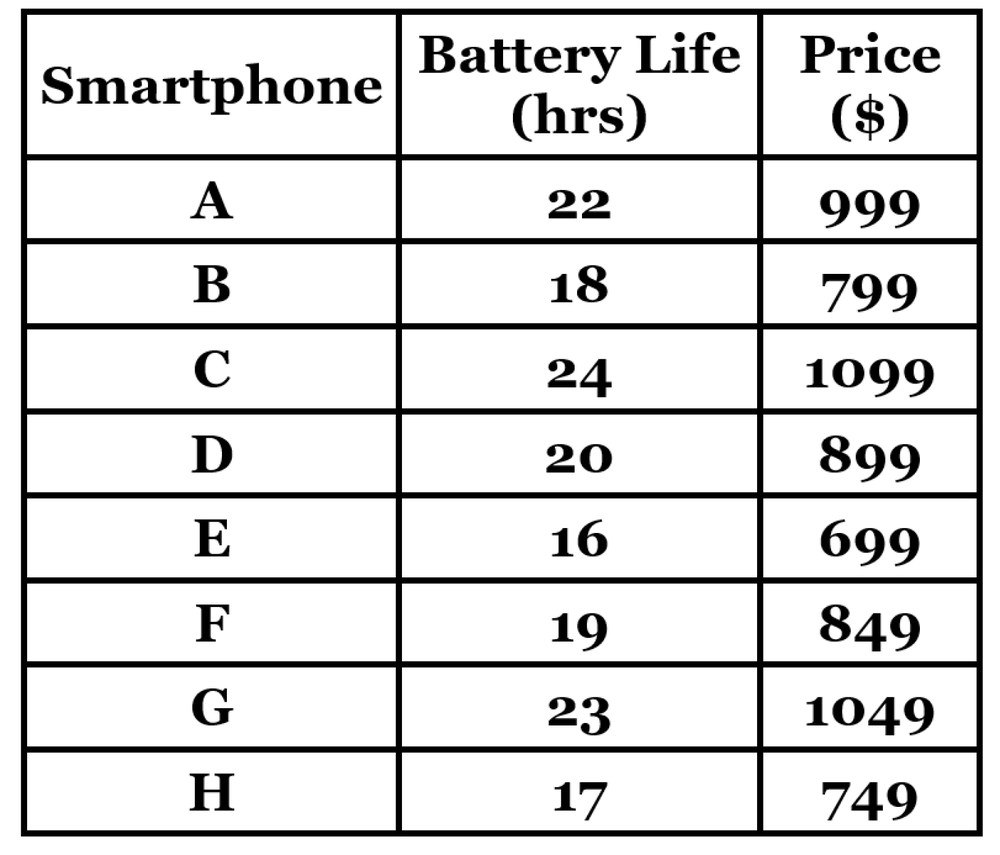
Use the rank correlation coefficient (Spearman’s ) to test the hypothesis of a correlation between battery life and price. Use . What conclusion can you draw?
A botanist records the amount of fertilizer in grams used and the resulting height in centimeters of tomato plants after two months. The data and the corresponding scatterplot are as follows:

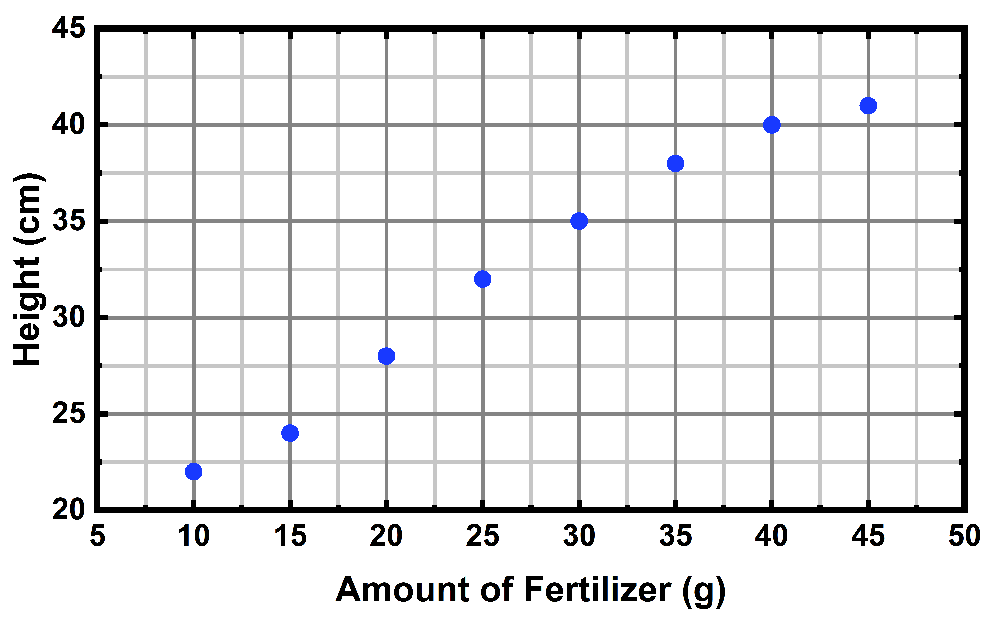
Calculate the value of the linear correlation coefficient and determine the critical values of at a significance level of . Is there enough evidence to support a claim that there is a linear correlation between the amount of fertilizer and plant height?